


Fear and greed. The two great driving forces of the financial markets. Fear is palpable at market bottoms, while greed is evident at tops. In the financial markets right now we're certainly a lot closer to the former than the latter. But how close is a top in the U.S. dollar index is the question on a lot of minds right now.
In the latest issue of Futures magazine, the dollar is once again in focus on the front cover. The headline reads "Shadow of Doubt: Could the U.S. dollar overshadow metal market fundamentals?" This dollar-related headline is significant in and of itself, coming as it does after a 10-week dollar rally. Could this be a temporary top?
The Futures magazine questions the strength of the legs underneath the gold market and brings up the possibility that the gold bull might be dead. The nascent strength of the dollar is a chief culprit, the article states. John L. Caiazzo, president of Acuvest, made the following statement in the article: "I can say this just so many times before I start to bore even myself....Don't bother charting gold, chart the dollar, or go back even further in the economic 'food chain' and chart interest rates internationally." He adds, "Interest rates interaction between the U.S. and its trading partners will direct the action in the U.S. dollar which in turn will direct the price of gold. What part of that statement do so-called 'gold bugs' not understand?" Caiazzo makes a good point, one worth listening to.

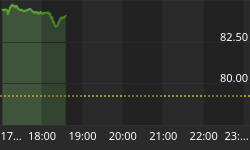
Let's turn our attention to the short-term dollar chart. The above daily chart of the U.S. dollar index shows the dominant pattern of a parabolic bowl-shaped curve which to date has been responsible for the dollar's bear market rally. As of Tuesday morning, May 4, the dollar is testing a very pivotal near-term level at around 89.50 in the dollar index. The 89.50-90 area is key for a number of technical reasons, including the fact that a 10-week uptrend line intersects there along with the 30-day moving average and the rim of a parabolic bowl in the daily chart. This means a critical parabolic curve is now being tested! If 89.50 is decisively broken, it should lift some pressure off the gold market for a while. Of course, the further below 89.50 the dollar falls the better it bodes for a recovery in gold prices since there are other critical trend lines and moving averages along the way. We'll address this ongoing scenario in future articles as the dollar situation unfolds.
A big question mark of this daily dollar chart is where exactly the mid-point, or "vertex," of the bowl lies relative to the dollar's price line. In Parabolic Analysis, where exactly the price of a stock or commodity (or index) bottoms relative to the bowl is very important and provides important clues as to whether the subsequent rally will be long-lasting or abortive. If price bottoms before or right at the mid-point of the bowl it typically points to a fairly strong rally ahead. If, however, price bottoms past the mid-point (i.e., right of center) it usually means the following rally will be short-lived and the bowl is usually broken, followed by more falling prices.
The problem with the bowl pattern in the above dollar chart is that it's very difficult to gauge where exactly the bottom occurs relative to the bowl -- before or after the mid-point? In other words, does the January low at about the 85 level count as the dollar's technical bottom or the second low at slightly below 85 in mid-February? This question will be moot, however, if the dollar closes decisively below 89.50 since it will constitute a violation of the bowl. From a gold bug's standpoint this is the best thing that can happen, near-term.
The Futures magazine article by Carla Cavaletti emphasized that when it comes to the current gold market, the dollar is firmly in the driver's seat (at least for now). I can't help but agree with that sentiment and I also agree with a quote in the magazine article to the effect that gold analysts should spend more time charting the dollar in order to get a pulse on the gold market.


