


April 27, 2004
The Nikkei has continued to slowly climb since the last update, and it's been wrestling with the 12,000 level for over a month now. But it now looks as if it may have worked its way into a tight spot. And despite a last-gasp moon shot in the Yen in late March, it only managed to put in a large negative divergence on the weekly MACD - which never turned up with the higher high on the Yen. The Yen has traced out a 5 wave decline from that high, and look ready for a continued decline. There are four charts below; let's look at the first two, which are Weekly and Daily charts of the Yen.


Over the past 6 months, the press has been so focused on the falling US Dollar they probably caught the bottom. When sentiment gets that extreme on one side, its time to look the other way. There are many fundamental economic arguments for holding the Yen over the Dollar, which may prove correct in the long run. But the charts are saying its time to sell the Yen vs. the Dollar right now, and the charts will lead you in the right direction much more often than arguments on the fundamentals.
The Weekly chart of the Yen above shows that the recent high was probably the last one for a while, and that the intermediate trend is down. The Weekly MACD remains pointed down. In the short-term, the Daily chart shows that the Yen rallied to its late-March high in 5 waves and then declined in 5 waves - which strongly suggests a trend change. It looks like the gap in the 88 area from September 2003 will be filled with this decline, and there is strong support near 86 on the Weekly chart. A decline to this area looks probable.
The Daily chart below shows the Nikkei's rally from April 2003. This rally is most likely an A-B-C correction that is almost complete. The blue trend lines on the chart below show Wave C (green) has taken the form of an Ending Diagonal, or rising wedge. The next break below 10,000 will probably be the start of a down trend in the Nikkei.
In EW terms, the Nikkei may have entered another long-term trading range similar to what occurred during the majority of the 1990's, or it may be headed to a new low over the next few years - there really is no way to know from this point. A year ago, it looked possible that the 2003 low on the Nikkei may have been the low. The impulsive rise from April to July was consistent with that scenario. But in the second half of 2003 through the beginning of 2004 began to suggest an A-B-C correction off the low instead of a larger degree impulsive wave. That is unfortunate, because an impulsive rise off the 2003 low would have made the Nikkei and Japan one of the best places be while N. America and Europe continued with their Bears. Instead, it looks like Japan will be taken along for the ride to the downside.

The last chart below is of the Japan iShares, ticker EWJ. It shows two clear a-b-c rallies from last year's low (in Black), and what is probably a complete large A-B-C correction in Blue. Note where EWJ has stopped - right at the 50% retrace. The chart suggests the Nikkei will put in a new low in the next year or two, perhaps while the US dollar rallies against the Yen. That is what the chart is suggesting, regardless of the fundamentals - it is telling us to be short the Nikkei and the Yen.

May 8, 2004 Update
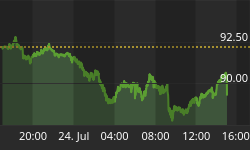
The Yen is following a most bearish course against the US Dollar as the Weekly MACD suggested it would. A break below major support at 89 on the Daily Yen chart above appears likely in the next week or two.
The Nikkei has broken below 12,000 and out of its rising wedge detailed on the Daily chart above. On a Weekly basis, the Nikkei closed just below its trend line from the 2003 low, and we may get a more decisive break in the next week or two. It appears highly likely that the Nikkei has completed an A-B-C rally off its 2003 low, and the trend is down for the foreseeable future. Once we see more of this decline on the charts, we will look at whether this year-long corrective rally was the first wave of a larger correction up, or a complete correction which now leaves the door open for a new post-1989 low.


