


The good news is:
• All of the major indices closed at recovery highs Friday.
The negatives
They are getting harder to find.
The market is overbought; the S&P 500 (SPX) was up every day last week
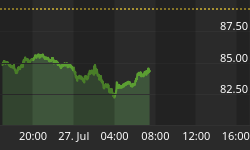
The chart below covers the past year showing the SPX in red and an indicator showing the percentage of the last 5 trading days that have been up in black. Dashed vertical lines have been drawn on the 1st trading day of each month.

We have seen this condition 4 other times in the past year. After the first two, September and October the SPX continued modestly upward for a few days before pulling back. After the 2nd two it just kept going.
Both volume and breadth (last weeks negatives) improved last week.
The Positives
Nearly every indicator, except for volume, confirmed Friday's high.
Between mid October and mid December the secondaries were underperforming the blue chips. They have resumed their upside leadership closing at recovery highs last Friday.
The chart below covers the past 2 months showing the SPX in red, the S&P mid cap (MID) in black, the NASDAQ composite (OTC) in blue and the Russell 2000 (R2K) in green. The indices have been plotted on log scales to show their relative strength.

Pullbacks can occur any time, but, with everything but volume confirming Friday's highs a pullback would represent a buying opportunity.
Seasonality
Next week includes the 5 trading days prior to the 2nd Friday (trading Friday) of January during the 2nd year of the Presidential Cycle.
The tables below show the return on a percentage basis for the 5 trading days prior to the 2nd Friday of January during the 2nd year of the Presidential Cycle. OTC data covers the period from 1963 - 2008 and SPX data from 1953 - 2008. Prior to 1953 the market traded 6 days a week so that data has been ignored. There are summaries for both the 2nd year of the Presidential Cycle and all years combined.
Average returns for the week prior to the 2nd Friday of January during the 1st year of the Presidential Cycle have been terrible. The market has been up about one third of the time with losses averaging over 1%. Averages over all years have been a little better.
Report for the week before the 2nd Friday of January.
The number following the year is the position in the presidential cycle.
Daily returns from Monday to 2nd Friday.
| OTC Presidential Year 2 | ||||||
| Year | Mon | Tue | Wed | Thur | Fri | Totals |
| 1966-2 | -0.02% | 0.17% | 0.27% | 0.05% | -0.12% | 0.36% |
| 1970-2 | 1.01% | 0.04% | -0.54% | 0.24% | 0.34% | 1.08% |
| 1974-2 | 0.39% | -0.44% | -1.97% | -0.85% | 0.89% | -1.98% |
| 1978-2 | -1.44% | -0.62% | -0.49% | 0.45% | 0.23% | -1.86% |
| 1982-2 | -1.69% | -0.78% | -0.85% | 0.09% | 0.77% | -2.47% |
| 1986-2 | 0.08% | 1.15% | -0.25% | -1.76% | 0.32% | -0.46% |
| 1990-2 | 0.11% | -0.42% | -1.33% | -0.41% | -2.04% | -4.09% |
| Avg | -0.51% | -0.22% | -0.98% | -0.50% | 0.03% | -2.17% |
| 1994-2 | 0.48% | -0.15% | 0.17% | 0.12% | 0.57% | 1.19% |
| 1998-2 | 0.80% | -0.88% | -1.16% | -0.40% | -3.36% | -5.01% |
| 2002-2 | -1.08% | 0.92% | -0.53% | 0.11% | -1.21% | -1.79% |
| 2006-2 | 0.57% | 0.07% | 0.48% | -0.63% | 0.02% | 0.50% |
| Avg | 0.19% | -0.01% | -0.26% | -0.20% | -1.00% | -1.28% |
| OTC summary for Presidential Year 2 1966 - 2006 | ||||||
| Avg | -0.07% | -0.09% | -0.56% | -0.27% | -0.33% | -1.32% |
| Win% | 64% | 45% | 27% | 55% | 64% | 36% |
| OTC summary for all years 1963 - 2009 | ||||||
| Avg | 0.41% | -0.10% | -0.09% | 0.50% | 0.22% | 0.93% |
| Win% | 68% | 53% | 47% | 74% | 70% | 64% |
| SPX Presidential Year 2 | ||||||
| Year | Mon | Tue | Wed | Thur | Fri | Totals |
| 1954-2 | -0.52% | 0.52% | 0.56% | 0.48% | 0.95% | 2.00% |
| 1958-2 | -0.46% | 0.79% | -0.02% | -0.59% | -0.93% | -1.22% |
| 1962-2 | -0.78% | 0.04% | -0.27% | 0.59% | 0.35% | -0.07% |
| 1966-2 | 0.20% | 0.09% | -0.24% | 0.18% | 0.15% | 0.39% |
| 1970-2 | 0.49% | -0.68% | -0.20% | 0.05% | -0.30% | -0.64% |
| Avg | -0.21% | 0.15% | -0.04% | 0.14% | 0.04% | 0.09% |
| 1974-2 | -0.84% | -1.99% | -2.81% | -1.10% | 1.37% | -5.36% |
| 1978-2 | -1.07% | -0.52% | -0.48% | 0.09% | -0.14% | -2.12% |
| 1982-2 | -2.32% | -0.41% | -1.22% | 0.57% | -0.18% | -3.56% |
| 1986-2 | -0.11% | 1.50% | -2.73% | -0.89% | -0.07% | -2.31% |
| 1990-2 | 0.45% | -1.18% | -0.66% | 0.35% | -2.47% | -3.50% |
| Avg | -0.78% | -0.52% | -1.58% | -0.20% | -0.30% | -3.37% |
| 1994-2 | 1.14% | -0.24% | 0.01% | -0.36% | 0.52% | 1.07% |
| 1998-2 | 0.21% | -1.07% | -0.27% | -0.83% | -2.97% | -4.92% |
| 2002-2 | -0.65% | -0.36% | -0.48% | 0.12% | -0.95% | -2.31% |
| 2006-2 | 0.37% | -0.04% | 0.35% | -0.63% | 0.12% | 0.17% |
| Avg | 0.27% | -0.43% | -0.10% | -0.42% | -0.82% | -1.50% |
| SPX summary for Presidential Year 2 1954 - 2006 | ||||||
| Avg | -0.28% | -0.25% | -0.60% | -0.14% | -0.33% | -1.60% |
| Win% | 43% | 36% | 21% | 57% | 43% | 29% |
| SPX summary for all years 1953 - 2009 | ||||||
| Avg | 0.13% | -0.19% | -0.29% | 0.25% | 0.06% | -0.04% |
| Win% | 58% | 39% | 40% | 71% | 54% | 51% |
Money supply (M2)
The money supply chart was provided by Gordon Harms. Money supply growth continues to fall.

Conclusion
The market followed the seasonal pattern for the 1st week of January leaving it overbought. If the seasonal pattern holds, next week should be down.
I expect the major averages to be lower on Friday January 15 than they were on Friday January 8.
This report is free to anyone who wants it, so please tell your friends. They can sign up at: http://alphaim.net/signup.html. If it is not for you, reply with REMOVE in the subject line.
In his latest newsletter, Jerry Minton confesses that his predictive abilities are deeply flawed. His outlook for 2010 is presented anyway as part of the annual fortune- telling ritual of the investment management business. Read it at: http://alphaim.net/.
Thank you,


