


Market Wrap
Week Ending 1/8/2010
The Dollar
This past week the dollar did not seem to have as great of an impact on other markets as it usually does. Some investors believe a decoupling is taking place. I'm not convinced, at least not yet.
One week does not constitute a trend. The dollar's December rally did not negatively affect the stock market, however, that may not continue to be the case. Time will tell. As the charts below show, the dollar has formed a falling flag. Whether the dollar breaks up or down out of the flag will have repercussions in other markets.
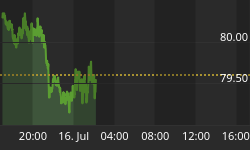
The dollar index fell 0.49 to close the week at 77.45 for a loss of 0.63%. Up first is the daily chart of UUP. The first thing to note is that MACD has made a negative crossover, which suggests further downside action, especially if RSI breaks below 50.
Resistance at 23.00 was eventually broken above, as targeted in recent reports; however, price has since backed off and is slowly declining in a falling flag formation. If price breaks below the bottom of the flag, more downside is likely. If price breaks out above the upper trend line - the rally will continue.
Note that a 50% retracement of the rally from 22 to 23 comes in around 22.50. The dollar could fall to this level and still resume its upward rally.

The weekly $USD chart shows MACD making a positive crossover, which suggests there is more intermediate term upside action possible. RSI would need to clear 50 for any rally to obtain.
Overlaid on the chart are the Fibonacci retracement levels from the March dollar high, which coincided with the March lows in stocks & commodities, to the recent Nov. dollar low. The first Fib level (38%) is at 80.11. Overhead resistance is marked at 78. Note the dollar has made a higher low, while gold made a lower high.

The monthly chart shows RSI readings at the top connected by vertical dotted lines to STO readings at the bottom of the chart that have signaled rallies in the past. The yellow resistance bands would need to be broken above if the dollar is to rally further.
Whether the dollar falls or rallies will have an effect on the precious metal markets, the commodity markets, and most likely the stock market as well. More proof needs to be seen before decoupling can be said to prevail.

Gold
With the dollar falling 0.63% gold had a good week, rallying up $40.80 to close at $1137.30 for a gain of 3.72%. Gold rallied 6 times the amount the dollar lost. The daily GLD chart below shows a rising flag taking shape. Gold is testing the upper trend line, with horizontal resistance marked just above (red line).
MACD shows a positive crossover still in effect. RSI is above 50, but is flattening out. If gold can break out above the flag formation and overhead resistance, a rally back up near its highs is possible. Conversely, if gold breaks below the flag, horizontal support at 105 comes into play.

Gold has a rising flag forming, while the dollar has a formed a falling flag. The first is usually resolved bearishly, while the latter tends to be bullish, although neither is a given. Presently, the dollar and gold are trending inversely to one another. How the flags are resolved will substantiate or deny the decoupling of the dollar from gold and other commodities.
The weekly chart shows a negative MACD crossover with the histograms flirting with negative territory. Together, the two hint at more downside action to come; however, STO looks like it may be about to turn up. Overlaid on the chart are the Fibonacci levels coming out of the April low to the Nov. high. Price bounced off support at the first Fib level (38.2%) at $1086.58.

Silver
Silver had a stellar week, rising $1.61 to close at $18.47, for a gain of 9.74%. The daily chart shows silver in a rising price channel since February.
Presently, silver is above its 50 dma, horizontal support at $18, and it's in the upper half of its price channel.
MACD is under a positive crossover and RSI has room to rise before it reaches overbought territory, if it has a mind to.

The weekly chart is close to making a positive MACD crossover, which would be a bullish development. STO needs to cross up through the 50 level for the rally to obtain. Volume expanded on the move, but not as much as it did during the recent decline.
Overlaid on the chart are the Fib levels coming out of the 2008 low and rising up to the 2009 high. Notice that silver has not yet corrected back to its first Fib level (38%) at 15. So far, silver has hung tough.

Gold Stocks
Gold & silver stocks had a good week, with the GDX rising almost 8% to 49.84. The daily chart shows price breaking below its rising price channel and subsequently rallying back up to regain the channel. Broken resistance at 48 has now become support.
MACD is under a positive crossover with rising histograms. Notice the vertical dotted lines that connect CCI readings breaking below 100 with the start of past corrections, followed by negative MACD crossovers. Watch CCI levels breaking below 100 to signal a possible reversal.

The weekly chart shows the GDX approaching overhead resistance, with a negative MACD crossover present. Histograms have turned negative as well. Declining money flows (CMF) are not encouraging and will need to change if a rally is to be sustained.


There are rumors of platinum and palladium exchange traded funds (ETF's) waiting in the wings, and the talk sparked significant rises in a couple of metal producers: Stillwater Mining (SWC) and North American Palladium (PAL). Both have recently been highlighted on our stock watch list. Stillwater produces platinum and PAL mines palladium.


The above excerpt is from this week's full market wrap report (35 pgs) available only at the Honest Money Gold & Silver Report website. The full report includes our directional market indicator table, proprietary stock watch list, and model portfolio allocations. Stop by and check it out. A free trial subscription is available by emailing your request to: dvg6@comcast.net.
Good Luck. Good Trading. Good Health. And that's a Wrap.

Come Visit Our Website: Honest Money Gold & Silver Report
New Book Now Available - Honest Money


