


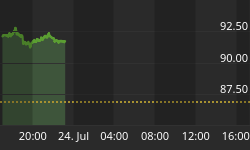


LET'S LOOK AT THE S&P 500 DAILY CHART

The key time period now is the one year cycle from the March low. After significant bear trends the low of that trend will represent a one year vibration, you can easily check for yourself. After significant bear moves looking one year from the low is as follows. 1932 low to low 371 days; 1938 low to low (376); 1939 low to high (364); 1949 low to high 363 days; October 1974 low to low (362 days); December 1974 low to low (365); 1982 low to low (365); 1987 low to high (367); October 2002 low to high 369 but sideways not trend change; March 2003 low to high (359). When we look further into this the last drive into those one year highs or lows in calendar days were either 22, 30 to 33 (one 36) and one 45 and one 60. So if we count back words from the early March date the last movement into a high or low should be starting from 45 days which was the last high on the 19th of January or 22 days on Feb 12 or 30 to 33 on Feb 1st through 4th. Since the one year vibration in time is a high probability and the move to complete that time period is one of three time windows how the index goes into those date will help determine if the one year vibration is a high or low. This is not a top to the bull trend but possibly a high for an intermediate term correction. But it needs to break 1104 to give some evidence of that intermediate term correction starting.
NOW LET'S LOOK AT A CHART SHOWING SUPPORT AND RESISTANCE

This chart is showing the last leg up broken into 1/8 and 1/3. These will be support and resistance if the trend is now correcting. The current support is only a 1/8 retracement and would be extremely small and keep the trend intact and in a very strong position, I doubt this will hold but that would be the conclusion if it does. This is also the previous resistance and is strong support from the "pattern of trending." Consensus shows a lot of bulls so further downside seems likely. The ¼ retracement of the last leg at 1080 is very important as that keeps the trend, since July, in a strong position for another rally as does the 1/3 to 3/8 of the range or 1044 to 1056. This is viewing the range from the last leg up from the July low. Viewing the entire bull campaign shows ¼ retracement of the Major Range at 1030 and 3/8 at 969. These would be the objectives for an intermediate term correction. The absolute maximum move down would be to that 969 level if the trend were to remain up. There could be a marginal break but any real trading below that level means the bull trend is complete. I doubt very much this could occur and still assume another leg up. The strength of that leg will be determined by the amount of retracement. The smaller the retracement the larger the next leg. So believing there is another leg up the index will hold that 969 level. The previous largest decline was 87 points (90) and 22 calendar days. Matching the price move down to 1060 is important. We'll look at what that indicates next show. In order to keep the trend since the November low intact the index needs to hold 1104 or 3/8 of that range. These price and time are posted on my website.
The major reason for a decline to continue from here is the uncertainty now related to the "financial reform." The air waves will be full of fear generated propaganda by the financial lobby indicating how disastrous it will be if these laws are enacted, this will fuel the uncertainty. I truly believe the senate is owned by the financial industry and nothing significant will get through this senate. And with the latest Supreme Court decision that corporations can spend as much money on public elections as they desire will strike fear in every politician who doesn't support the banks.


