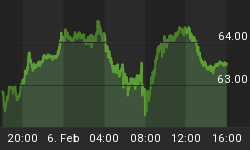
After a few sharp sell off days, the markets have put in a rather weak upside day and faded into the close. It looks like an inside day and that's usually a sign of continuation.

The daily chart above of the DOW reflects today was an inside day. The markets tried to rally early but faded into the end of the session. The next area of support is the prior peak at the price level of 10,100, which we should expect to test in the near future. Also, the RSI has yet to test 30 (over sold territory), which allows for more room to the down side on this leg.

The daily chart above of the SP500 also demonstrates the same qualities as the DOW, with a small support range just below current price levels.
Last week, I started some new short positions for my parent's trading account, and we've had some very easy and nice gains, and as always we've taken some chips/gains off the table We've also increased some and added a couple new short positions that look ripe for further downside trading gains.
So far, the move down looks impulsive, which would indicate wave A or 1 down, which indicates the move down is still on-going.
It will be interesting to see if the next support levels hold or not. That being said, the next low risk entry on the short side is a bounce up into wave B or 2. As always, I'm looking for form or price structure to confirm that view, which would support another leg down afterward, which is already indicated by the impulsive move lower so far. That's my take for now!


