This week, the markets put in a rally of slightly more than 200 points on the DOW over Monday and Tuesday. This 200 point move was done so on light volume, which provided the clue the markets were not out of woods. It was the light volume rally that allowed me to comfortably increase my short exposure for my parents in their trading accounts. In fact, if you look at the entire decline, the down day volume is higher than the up day volume from the top (Except for Friday, February 5th).
Mid week the markets reversed hard, which confirmed the Three Back Crows pattern I highlighted in "Has the Fat lady Begun to Sing?" The pattern preludes further weakness, which we got. The markets spent most of Friday to the down side, which is when we closed most of short positions when the markets were trading at their bottom Bollinger Band.
Like last week, I didn't want to go into the weekend with significant short positions. We only kept a couple short positions that still reflect some kind of negative technical analysis. Then, late on Friday, the markets rallied back to a slight gain. Friday's price action created a Dragonfly Doji, which we typically see at some sort of bottom.
Dragonfly Doji: The Dragonfly Doji is the bullish counter part to the Gravestone Doji. The Dragonfly has the open/close at the highs of the session. This means the market had touched much lower lows during the session, but impressively managed to close at, or very close to, the highs. This is like the Hammer, but the Hammer has a small real body where the Dragonfly has no real body since it is a Doji. (Japanese candlestick Charting Techniques, Second Edition, Steve Nison, page 162).
Below is a daily chart of the DOW, which you can easily see all of the above technical price and volume activity of the past few weeks.

On January 29th, I wrote, "Bang: Right Down to Support". In that, I stated:
The daily chart of the $VIX reflects a bull flag (wave 4) in what looks like an impulse (5 waves) move. A break above the flag pattern would be initial confirmation. The daily $VIX is hinting to possibly further weakness for the current move lower in the markets.
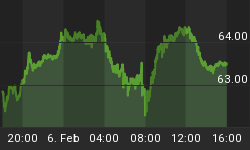
The markets proved that view to be correct this week. Below is a chart of the $VIX.

The $VIX couldn't hold moving higher Friday and gave up all of its gains corresponding with the markets reversing all of Friday's losses. If the above 5 waves is complete, it too suggests a pull back in the $VIX or a bounce in the markets is due.
The Bullish Case:
The bullish view would be something to this affect: The move down from the recent price high is nothing more than a short term zig-zag (ABC) corrective pattern with today's wash out (Dragonfly Doji) serving as a bottom to the ABC pattern, or at worst the bottom of abc of A. In either case, a bounce is due in the markets moving forward.
If we are going to move into new price highs over the coming several weeks, I expect the Big Caps to be the leaders moving the markets to new highs. I would expect them to revisit their highs and resistance levels.
The markets would possibly travel up towards their 200 week moving average (Roughly DOW 11160). The Elliott Wave count up is then expanding further. If this is the case, then the time frame for the next price high in my view is end of March or early April. Note: The markets have not done enough downside technical damage to rule out this bullish view.
The other thing that leads to this view is no topping price pattern in place to support the move up has finished. It doesn't have to end that way, but it would be a clear signal.
The Bearish Case:
The bearish case is the market high represents the end of the triple zig-zag up of wave 2 or B, the move down has been impulsive, and the Dragonfly Doji serves as a short term low, and a bounce into corrective wave 2 higher is due. The bounce could retrace a good position of the current sell off and bounce into the 10300-10400 level on the DOW. Then we should expect the markets to roll over into a much larger sell off as we enter wave 3 of larger wave 1 down.
SUMMARY:
The above bull and bear case is simply the way the markets look at this junction. Could it be something different? Absolutely, as Elliott Wave patterns often expanding into the unseen wave structure! In either view above, the markets seem due a bounce, which confirms the decision to exit most of my short positions going into close of Friday.
Next week should provide better clarity and confirm a bounce of some kind is due. Could the markets continue lower? Absolutely, the weekly MACD has rolled over, and we have expanding Bollinger Bands on the daily chart. If the markets continue lower the next support zone is 9500-9700.
As always, it's Mr. Market that dictates the Elliott Wave count, not the analyst, and flexibility is always required and we can only analyze the way it looks at the moment.
Hope all is well


