


2/14/2010 6:48:27 PM
To ensure delivery and prevent this e-mail from being delivered to your bulk mail folder, please add our 'From' e-mail address, info@stockbarometer.com, to your address book or preferred sender list.
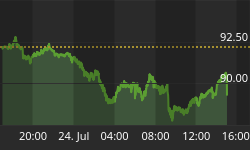
Here are our Buy and Sell Signals over the last 6 months:

When people ask what we do, I say it's very simple - we tell people when to buy and when to sell.
While our advise is simple, the logic behind it has been in development over the past 10 years. Calling the market is by no means a perfect science. I think of the quote - "life is like a box of chocolate, you never know what you'll get" and the market is no different. It's all about liklihood and probability, magnitude and frequency and knowing what moves the market. We do all that for you and give you advice that you can use to improve your investments.
Whether you're saving for retirement, your child's education or saving for something like a boat or a second home (or like me, a new kitchen), you can use our advise. You don't have to be a trader for this information to help you. Here's what I mean:
401k accounts - most people dollar cost average into their investments. Instead of doing that, simple wait for our buy signals to put your money to work. And when we issue a sell signal, this might be a good time to dollar cost average into bonds instead of stocks. In fact, in our Daily Stock Barometer, we also provide daily advice on bonds, gold, oil and the US Dollar.
It's all about empowering you to make better decisions with your investments.
Roth IRA Accounts are a little different. Mine, for example, while I do deposit the standard amount in periodically, it goes into cash and I wait for the market to get really scary before putting that money to work. This takes patience and watching the market for several months at a time, but your patience will be rewarded, trust me.
No longer will you buy at tops and sell at bottoms.
And on cash (or margin) investment accounts, which most of us use to save/invest for larger purchases, like cars, boats, new kitchens or second homes - these are where you can really make a big impact on your financial situation. Again, having the patience to wait for longer term buy signals can really produce enough returns, almost like having a second income. Except that you don't know when these 'market crashes' or what I like to call opportunities are going to occur.
The best thing to do is to have the capital available on the sidelines to take advantage of these opportunities when they come. And be ready to pull the trigger when they do come.
Guided by our advice, you can be there.
There are 3 ways you can get our timing advice:
1) Subscribe to our Daily Stock Barometer for 24.95 per monthh, each day you'll get timing advice on the QQQQ as well as oil, bonds, gold, and the dollar.
2) Subscribe to our QQQQ/Rydex/Options Trader, which will only give you the QQQQ buy and sell signals when they're released. This saves you from having to read all the commentary on a daily basis.
3) Subscribe to the Premier Service $69.95/month, which gives you all the following services (a $120/month value):
The Daily Stock Barometer (24.95)
The QQQQ/Rydex/Options Trader (24.95)
Explosive Stock Alert (9.95)
Stock Options Speculator (39)
Covered Call Alert (24.95)
In addition, upgrade to an annual subscription to any one of these services and get access to IRG Market Sentiment Indicators - 150 indicators in all updated every week.
IRG Market Timing & Sentiment Indicators
Get all our timing research, roughly 150+ market timing indicator
10 Years worth! - Updated every single week

Stock Barometer Analysis
The barometerremains in Buy Mode.
The Stock Barometer is my proprietary market timing system. The direction, slope and level of the Stock Barometer determine our outlook. For example, if the barometer line is moving down, we are in Sell Mode. A Buy or Sell Signal is triggered when the indicator clearly changes direction. Trend and support can override the barometer signals.
Money Management & Stops
To trade this system, there are a few things you need to know and address to control your risk:
- This system targets intermediate term moves, of which even in the best years, there are usually only up to 7 profitable intermediate term moves. The rest of the year will be consolidating moves where this system will experience small losses and gains that offset each other.
- This system will usually result in losing trades more than 50% of the time, even in our best years. The key is being positioned properly for longer term moves when they come.
- Therefore it is vitally important that you apply some form of money management to protect your capital.
- Trading a leveraged index fund will result in more risk, since you cannot set stops and you cannot get out intraday.
Accordingly;
- Make sure you set your stops so that you can lose no more than 2% per trade (based on the QQQQ if you're trading leveraged funds and options with our trading service).
Angelo Campione's Advantage Credit Spreads
Use Options to Target Consistent & Conservative Profits - over 80% annualized in 2009 with only one loss of -2.5%!
Potential Cycle Reversal Dates
2010 Potential Reversal Dates: 1/19, 1/28, 3/2, 3/23. We publish dates up to 2 months in advance.
We still see a move higher into 3/2. That's my story and I'm sticking to it...
My Additional timing work is based on numerous cycles and has resulted in the above potential reversal dates. These are not to be confused with the barometer signals or cycle times. However, due to their past accuracy I post the dates here.
2009 Published Reversal Dates: 1/20, 2/11, 3/7, 3/15, 4/8, 4/16, 4/27, 5/7, 6/8, 7/2, 7/17, 9/14, 10/10, 10/24, 11/12, 11/30, 12/9, 12/21, 12/29. 2008 Potential Reversal Dates: 12/31, 1/11, 2/1, 2/13, 3/6, 4/5, 4/22, 5/23, 6/6, 6/27, 7/13, 9/2, 10/3, 10/22, 11/10, 12/11. 2007 Potential Reversal Dates: 1/10, 1/14, 1/27, 1/31, 2/3, 2/17, 3/10, 3/24, 4/21, 5/6, 6/15, 8/29, 10/19, 11/29, 12/13, 12/23, 12/31, 1/11/08. 2006 potential reversal dates: 1/16, 1/30, 2/25, 3/19, 4/8, 5/8, 5/19, 6/6(20), 7/24, 8/20, 8/29, 9/15, 10/11, 11/28. 2005 Potential reversal dates: 12/27, 1/25, 2/16, 3/4, 3/14, 3/29, 4/5, 4/19, 5/2, 6/3, 6/10, 7/13, 7/28, 8/12, 8/30-31, 9/22, 10/4, 11/15, 11/20, 12/16.
The J.E.D.I. Trader
Stocks, Options and Options on futures advisory service (up over 100% in 2008).
Spread Indicators
Use the following spread/momentum indicators to assist in your trading of the QQQQ, GLD, USD, USO and TLT. They are tuned to deliver signals in line with the Stock Barometer and we use them only in determining our overall outlook for the market and for pinpointing market reversals. The level, direction, and position to the zero line are keys in these indicators. For example, direction determines mode and a buy signal 'above zero' is more bullish than a buy signal 'below zero'.
QQQQ Spread Indicator (NASDAQ:QQQQ)

The QQQQ Spread Indicator will yield its own buy and sell signals that may be different from the Stock Barometer. It's meant to give us an idea of the next turn in the market.
Lynn T's 1-2-3 PLUS Alert
Provides buying and selling advice with 1/3 Index positioning for trends
use Leverage and our advice as a hedge for your current portfolio.
Gold Spread Indicator (AMEX:GLD)

Want to trade Gold? Use our signals with the Gold ETF AMEX:GLD. Gold gives us a general gage to the overall health of the US Economy and the markets.
The Advantage Report
Market timing advice for only $10.95/month
US Dollar Index Spread Indicator (INDEX:DXY)

Want to trade the US Dollar? Use our signals with the Power Shares AMEX:UUP: US Dollar Index Bullish Fund and AMEX:UDN: US Dollar Index Bearish Fund.
Want 50 Covered Call plays every week?
Try our Covered Call Alert.
Bonds Spread Indicator (AMEX:TLT)

Want to trade Bonds? Use our signals with Lehman's 20 year ETF AMEX:TLT. The direction of bonds has an impact on the stock market. Normally, as bonds go down, stocks will go up and as bonds go up, stocks will go down.
OIL Spread Indicator (AMEX:USO)

Want to trade OIL? Use our signals with AMEX:USO, the OIL ETF. We look at the price of oil as its level and direction has an impact on the stock market.
Supporting Secondary Indicator

We daily monitor hundreds of popular and proprietary technical indicators that break down market internals, sentiment and money flow to give us unique insight into the market. We feature at least one here each day in support of our current outlook.
The McMillan Letter ($8.95/Month)
Join Analyst Mark McMillan as he explores and identifies current market opportunities
Summary of Daily Outlook
We remain in Buy Mode, looking for the market to move higher into March.
Nothing has changed with our forecast - the energy still exists for a rally - a pretty significant rally.
If you are an annual subscriber, the above charts are examples of the over 150 charts you would get access to - updated every weekend - for you to make better investment and trading decisions. We also have over a decade of these indicators available. I invite you to upgrade to an Annual subscription today and start taking advantage of this offer.
If you want more information, we also offer a daily blog and you can follow our blog posts on on Twitter and on Facebook. I'll be providing more information as well as updates from our 6 other advisors. Please visit the site and sign up (and tell your friends - it's free!)
If you have any questions or comments, email me at Jay@stockbarometer.com.
Stock Barometer Premier Membership
Receive 5 Newsletters, including the Daily Stock Barometer, Stock Options Speculator, QQQQ/Rydex Trader, Covered Calls & Explosive Stock Alert FOR ONE LOW PRICE.
Want Stock Trading ideas? Then try Explosive Stock Alert
Weekly Updates on Uptrending stocks in all industries.
$9.95 per month or $95 per year (click here).
Regards,


