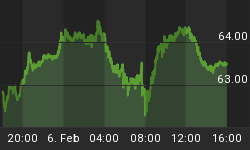
Below is the daily chart of GLD. The chart reflects an inverse head and shoulders pattern in development. The measured target is $123, which will also cover the chart gap at $117-118.

Since GLD has yet to break above the neckline, we have no confirmation of the pattern. Also, the right shoulder could take several more days to complete. We have low volume on the right shoulder, which is a good preliminary indicator. We'd also want to see the RSI and AMCD turn up and support a break out with ideally an increase in volume. All things to keep our eyes on!
Hope all is well.


