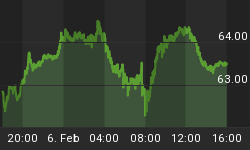
The Primary Support (now Resistance) Test is happening today ...
You all know how important the Institutional Index of "core holdings" is ... it is not really an index so it cannot be hedged, manipulated, or played with in any way. It is a pure representation of what the "core holdings" are doing relative to the market.
It has more accuracy relative to support and resistance lines, and more accuracy relative to Fibonacci studies. For example, on October 11th. 2007, the Institutional "core holdings" index hit an EXACT 61.8% Fibonacci retracement while the other indexes did not. That day marked the EXACT top of the market.
In April of 2009, the Institutional Index broke above its down trend and started its new Bull market as seen on the chart. During this course of time, two very clear and important support levels became apparent ... a Primary and a Secondary support level as seen below.
From April of 2009, everything was running pretty smooth until the Index fell below its support on January 22nd. The Index then dropped to the Secondary support on February 5th. where it held its support and the market moved up from there.
At the close yesterday, the Institutional Index closed slightly above the resistance coming from the Primary Resistance line.
That takes us to today, March 18th. 2010. It is now 11 AM, and the index is exactly at the same level as yesterday's close.
So what does this all mean? This is no ordinary day ... It means that the market is facing a Major (see Primary line) Resistance level test today. This challenge could last into Friday or Monday. In any event, this is a very important market juncture. (Realize that a close above the Primary line would have to withstand holding a test of that support.)
***The daily and 60 Minute Institutional charts are posted every morning on our paid subscriber site.


