


The major stock market indices added to their gains this week - obtaining comfort from the Fed's policy statement that the "juice" was not about to be removed anytime soon - and hit 18-month highs before closing down on Friday as "quadruple witching day" in the US weighed on sentiment. A day earlier on Thursday, the S&P 500 tracking ETF (SPY) broke a 14-day winning streak - its longest since the launch of the ETF in 1993.
The Federal Open Market Committee (FOMC) on Tuesday once again announced that the fed funds rate target was likely to remain "exceptionally low" for "an extended period". The communiqué was slightly more upbeat on the outlook for the economy, saying the labor market was "stabilizing" (last statement: "the deterioration in the labor market is abating"), although a number of constraints on growth remained.
The FOMC's statement "met market expectations on the three key aspects of leaving interest rates unchanged, maintaining dovish language about future policy moves and allowing the special programs to lapse," Mohamed El-Erian, chief executive and co-chief investment officer of Pimco told Reuters (via MoneyNews). He added that the end of the Fed's program of purchasing $1.25 trillion of mortgage-backed securities at the end of March signaled a form of credit tightening. Traders are also expecting an increase in the Fed's discount rate from 50 basis points above the fed funds rate to the pre-crisis margin of 100 basis points.
Meanwhile, US Senate Banking Committee chairman Christopher Dodd introduced a revised version of a financial regulatory reform bill on Monday. "The Act's reduced risk retention requirements and its recognition of its potentially negative impact on access to credit by consumers and businesses are encouraging, but the amount of discretion left with the regulators would be troubling to securitizers and originators. However, the delay in the effectiveness of final implementing regulations until, at the earliest, 2012, would give the industry an opportunity to adjust to the new requirements or to petition Congress for relief," reported lawyers Edward De Sear and Charles Sweet (Bingham).

Source: Tom Toles, GoComics.com, March 18, 2010.
The past week's performance of the major asset classes is summarized in the chart below - a somewhat mixed picture with equities, high-grade corporate bonds, gold, government bonds and the US dollar all higher as pundits waxed and waned between risky assets and safe havens. However, oil and commodities were pushed lower on the back of the stronger greenback. It should be interesting to see how the bond vigilantes handle this week's auction of $118 billion worth of Treasuries, in the joint-largest auction on record. (For some perspective regarding the short-term outlook for the various asset classes, click the following links for Adam Hewison's (INO.com) latest technical analyses: S&P 500, US dollar, gold bullion and crude oil.)

Source: StockCharts.com
A summary of the movements of major global stock markets for the past week and various other measurement periods is given in the table below.
The cyclical bull market that commenced on March 9, 2009 marched higher during the past week, albeit with some hesitancy and a weak finish by the close. The MSCI World Index and the MSCI Emerging Markets Index gained 0.8% and 0.9% respectively.
As one would expect during a bull market, small caps have been a leading performer since the low of March 9 last year, with the Russell 2000 Index gaining 96.3% compared to a rise of 71.4% in the S&P 500 Index. Considering the last few days, however, small caps seem to have been tiring. As a result, the Russell 2000 Index has been the only major US stock market index to register a loss for the past week. As mentioned in a post yesterday, I will be keeping a close watch on this possible canary in the coalmine in order to gauge the most likely short-term direction for small caps and stocks in general.

Top performers among the entire spectrum of stock markets this week were Ukraine (+8.1%), Qatar (+7.3%), Thailand (+6.7%), Uganda (+4.8%) and Greece (+3.7%). At the bottom end of the performance rankings, countries included Cyprus (-6.7%), Costa Rica (-3.5%), Malawi (-3.4%), Nepal (-2.8%) and Macedonia (-2.7%).
Of the 96 stock markets I keep on my radar screen, 64 (last week 74%) recorded gains, 33% (21%) showed losses and 3% (5%) remained unchanged. The performance map below tells the past week's mostly bullish story.
Emerginvest world markets heat map

Source: Emerginvest (Click here to access a complete list of global stock market movements.)
Nine of the ten economic sectors of the S&P 500 closed higher for the week, with Telecoms (+2.4%) and Industrials (+2.2%) leading the pack and Energy (-1.1%), Materials (+0.2%) and Technology (+0.2%) forming the rear guard.

Source: US Global Investors - Weekly Investor Alert, March 19, 2010.
John Nyaradi (Wall Street Sector Selector) reports that as far as ETFs are concerned, the winners for the week included iShares MSCI Thailand (THD) (+6.2%), iShares Dow Jones US Health Providers (IHF) (+4.2%) and iShares MSCI South Africa (EZA) (+3.7%).
At the bottom end of the performance rankings, ETFs included First Trust ISE-Revere Natural Gas (FCG) (-5.7%), United States Natural Gas (UNG) (-5.5%) and Claymore/MAC Global Solar Energy (TAN) (-5.4%).
Criticizing Paul Krugman's comments that the US should consider a 25% surcharge on Chinese goods, the quote du jour this week comes from Stephen Roach, chairman of Morgan Stanley Asia. He said in a Bloomberg interview: "We should take out the baseball bat on Krugman. ... They don't want to look in the mirror. America doesn't have a China problem. It really has a savings problem. America has the biggest shortfall of national savings of any leading country in modern history. And when you don't have savings you have to run current account deficits to import surplus savings from abroad and run massive trade deficits to attract the capital. Last year America ran trade deficits with over 90 - that's right nine zero - countries. ... Isn't it the height of hypocrisy that America can articulate a particular position in its currency but the Chinese are not allowed to do that." (Hat tip for transcript: Credit Writedowns.)
Elsewhere, the Financial Times reported that President Barack Obama appeared to be nearing victory in his epic struggle to push healthcare reform through a reluctant US Congress in a vote today (Sunday).
Next, a quick textual analysis of my week's reading. This is a way of visualizing word frequencies at a glance. The usual suspects such as "bank", "debt", "government", "market" and "rate" featured prominently, with "China" also again in the limelight as China's Premier Wen Jiabao rebuffed calls from the US for the renminbi to appreciate.

The major moving-average levels for the benchmark US indices, the BRIC countries and South Africa (where I am based in Cape Town when not traveling) are given in the table below. With the exception of the Shanghai Composite Index that is flirting with its 50- and 200-day lines, the indices in the table are all trading above their key moving averages.
The table also provides the February lows for the various indices as these must hold in order for the cyclical bull market to remain intact.

I am repeating the following paragraph from last week's review as it is worth revisiting: "Using Fibonacci retracement lines, the S&P 500 is now testing the 62% retracement line drawn from the May 2008 peak to the March 2009 bottom (see purple lines). According to John Murphy (StockCharts.com), a break of this key upside target raises the possibility that the Index could retrace 62% of the entire bear market that started in the fourth quarter of 2007, in which case the potential upside target is 1,232 (see green lines)."

Source: StockCharts.com
Also commenting on the technical picture of the S&P 500, Kevin Lane (Fusion IQ) said: "We remain cautiously optimistic with the trend up, internals strong, the Russell 2000, the NASDAQ and now the S&P 500 at new recovery highs. Skeptics remain the loudest people in the room and while their concerns may be valid we have learned that the market rewards the minority and confounds the majority. The S&P 500 cleared its previous resistance peak near 1,150 and now looks to challenge the 1,200 level. Although there may be some back and filling along the way, we have long argued that there would be one last move up driven by investors who skeptically avoided the market."
A week ago, Jeffrey Saut (Raymond James) said: "Nassim Taleb (trader extraordinaire) has 10 rules. Rule number 8 reads: 'No matter how confident, always protect the downside.' We agree and therefore always try to 'look' down before looking up in an attempt to manage the risk. As for the 'here and now', the broadest index of them all, the Wilshire 5000, has strung together 11 consecutive higher sessions, a feat not seen since the mid-1990s. Accordingly, it is pretty overbought on a short-term basis. That upside skein can be seen in the candlestick charts, which have not experienced a downside 'red candlestick' session since the upside reversal of February 25, 2010. [PduP: Last week saw three declines.]
"We are therefore turning cautious, but not bearish, on a trading basis. That strategy suggests a short-term correction is potentially due, but NOT an intermediate-term bearish decline. Indeed, since the end of the envisioned January/February 'selling stampede', we have been constructive on stocks. However, we currently think pairing some trading positions, and/or raising stop-loss points, is warranted.
"Meanwhile, the Reuters/Jefferies CRB Index (commodities) broke below its rising trendline, the 10-Year Treasury Yield Index (TNX/3.71) broke above its 50-day moving average (read: higher rates), the Volatility Index (VIX/17.58) continued to trade below 18 (read: too much complacency), mutual fund cash positions are at historic lows of 3.6%, and the NYSE overbought/oversold indicator tagged a rare overbought reading above 90 last week. Ergo, color us cautious in the very short-term."
"Where breadth goes, the market usually follows," goes an old market saw. Analyzing market internals, the number of S&P 500 stocks trading above their respective 50-day moving averages has increased to 87% from 21% in early February (see chart below). "At these levels, there really hasn't been much more room to run on the upside before a short-term pullback (or at least sideways trading) has been seen," said Bespoke. For a primary uptrend to be in place, the bulk of the index constituents also need to trade above their 200-day averages. The number at the moment is 90% - somewhat down from its September peak of 95%, but nevertheless firmly in bullish terrain.

Source: StockCharts.com
In addition to being overbought, the S&P 500 is also now expensively valued on a long-term cyclically adjusted PE (CAPE) basis, according to Robert Shiller, economics professor at Yale and author of, among others, Animal Spirits, Subprime Solution and Irrational Exuberance.
In order not to work with notoriously unreliable forward-looking earnings estimates, I have always preferred using Shiller's CAPE methodology, or normalised earnings, as they average ten years of earnings. This measure provides a good picture of the market's value regardless of where we are in the business cycle. I have therefore been updating a CAPE chart for a number of years. On this basis, the multiple has increased to 20.5 since the March low of 13.3, representing an overvaluation of 25.0% when compared to a long-term average of 16.4.

For more discussion on the economy and financial markets, see my recent posts "Picture du Jour: Keep an eye on small caps", "Government bonds - what's up?", "Is real estate rolling over?", "Technical Talk: One last move up", "Chinese stocks - finely balanced", "Stock market valuation is stretched on long-term basis", "Author Michael Lewis on Wall Street's delusion" and "Barron's Confidence Index - more work to do". (And do make a point of listening to Donald Coxe's webcast of March 19, which can be accessed from the sidebar of the Investment Postcards site.)
Twitter and Facebook
I regularly post short comments (maximum 140 characters) on topical economic and market issues, web links and graphs on Twitter. For those readers not doing so already, you can follow my "tweets" by clicking here. You may also consider joining me as a friend on Facebook.
Economy
The Recession Status Map below, courtesy of Dismal Scientist Economy.com, aggregates growth statistics from around the world and allows one to see at a glance which economies are in recession, at risk, recovering or expanding. Click here to link to the interactive version.

Source: Dismal Scientist
"Global businesses remain cautious. They are no longer panicked as they were a year ago, but they still have yet to regain the confidence that prevailed prior to the financial crisis and Great Recession. Businesses are upbeat when broadly assessing current conditions and the outlook through this summer. They are much less sanguine when responding to specific questions regarding the strength of sales, hiring and inventories," according to the results of the latest Survey of Business Confidence of the World by Moody's Economy.com. As has been the case since the beginning of the global economic recovery in the middle of 2009, South Americans are the most upbeat and North Americans the most nervous. Confidence is strongest among financial firms and weakest among those that work in real estate and government.

Source: Moody's Economy.com
Meanwhile, German investor confidence fell in March for the sixth consecutive month. The ZEW indicator of economic sentiment dropped to 44.5, its lowest level since July 2009, from 45.1 in February. Investor confidence has been weighed down by concerns about large budget deficits in other eurozone member countries such as Greece.
The Bank of Japan (BoJ) last week adopted further monetary easing by doubling the size of a liquidity program for banks, whereas Brazil kept its monetary policy unchanged. However, as inflationary pressures start to build, the Reserve Bank of India increased interest rates for the first time since July 2008.
A snapshot of the week's US economic reports is provided below. (Click the links to see Northern Trust's assessment of the various data releases.)
Friday, March 19
• US debt holdings of foreign central banks continue to grow
Thursday, March 18
• Contained consumer prices supportive of easy monetary policy
• Index of Leading Indicators - projection of economic growth remains intact
• Total continuing claims persist at high level
Wednesday, March 17
• Effective federal funds rate is moving closer to target federal funds rate
• Lower energy prices account for dip in Wholesale Price Index
• Housing market update - Mortgage Purchase Index
Tuesday, March 16
• FOMC policy statement - Fed is optimistic about labor market compared with view in January
• Construction of new homes standing still - will activity pick up soon?
Monday, March 15
• Factory production declined, weather may have played a role
• Decline of Housing Market Index is Troubling
Commenting on the growth outlook for the US economy, Asha Bangalore (Northern Trust) said: "The Conference Board's Index of Leading Economic Indicators (LEI) increased 0.1% in February after a 0.3% increase in the prior month. On a year-to-year basis, the January-February average shot up 9.6%, which exceeds the high recorded in the 2001-2007 expansion. The main takeaway is that projections of economic growth remain in place."

Source: Asha Bangalore, Northern Trust - Daily Global Commentary, March 18, 2010.
Week's economic reports
Click here for the week's economy in pictures, courtesy of Jake of EconomPic Data.
| Date | Time (ET) | Statistic | For | Actual | Briefing Forecast | Market Expects | Prior |
| Mar 15 | 08:30 AM | Empire Manufacturing Survey | Mar | 22.86 | 22.0 | 22.0 | 24.91 |
| Mar 15 | 09:00 AM | Net Long-Term TIC Flows | Dec | $19.1B | $42.50B | $47.5B | $63.3B |
| Mar 15 | 09:15 AM | Capacity Utilization | Feb | 72.7% | 72.5% | 72.5% | 72.5% |
| Mar 15 | 09:15 AM | Industrial Production | Feb | 0.1% | -0.2% | 0.0% | 0.9% |
| Mar 16 | 08:30 AM | Building Permits | Feb | 612K | 610K | 601K | 622K |
| Mar 16 | 08:30 AM | Export Prices ex agriculture. | Feb | - | NA | NA | 0.7% |
| Mar 16 | 08:30 AM | Housing Starts | Feb | 575K | 550K | 570K | 611K |
| Mar 16 | 08:30 AM | Import Prices ex oil | Feb | 0.2% | NA | NA | 0.4% |
| Mar 16 | 08:30 AM | Export Prices ex agriculture | Feb | -0.2% | NA | NA | 0.7% |
| Mar 17 | 08:30 AM | Core PPI | Feb | 0.1% | 0.1% | 0.1% | 0.3% |
| Mar 17 | 08:30 AM | PPI | Feb | -0.6% | -0.3% | -0.2% | 1.4% |
| Mar 17 | 10:30 AM | Crude Inventories | 03/13 | 1.01M | NA | NA | 1.43M |
| Mar 18 | 08:30 AM | Core CPI | Feb | 0.1% | 0.0% | 0.1% | -0.1% |
| Mar 18 | 08:30 AM | CPI | Feb | 0.0% | -0.1% | 0.1% | 0.2% |
| Mar 18 | 08:30 AM | Initial Claims | 03/13 | 457K | 460K | 455K | 462K |
| Mar 18 | 08:30 AM | Continuing Claims | 03/6 | 4579K | 4500K | 4522K | 4567K |
| Mar 18 | 08:30 AM | Current Account Balance | Q4 | -$115.60 | -$117.5B | -$119.0B | -$102.3B |
| Mar 18 | 10:00 AM | Leading Indicators | Feb | 0.1% | 0.0% | 0.1% | 0.3% |
| Mar 18 | 10:00 AM | Philadelphia Fed | Mar | 18.9 | 17.8 | 18.0 | 17.6 |
Click here for a summary of Wells Fargo Securities' weekly economic and financial commentary.
Next week sees Fed chairman Ben Bernanke testifying in Washington on exit strategy (Thursday, March 25). In addition, US economic data reports for the week include the following:
Monday, March 23
• Existing home sales
• FHFA Home Price Index
Tuesday, March 24
• Durable orders
• New home sales
Wednesday, March 25
• Jobless claims
Thursday, March 26
• GDP
• Michigan sentiment
Markets
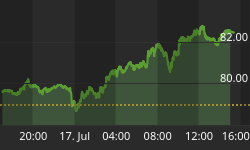
The performance chart obtained from the Wall Street Journal Online shows how different global financial markets performed during the past week.

Source: Wall Street Journal Online, February 26, 2010.
Final words
Marilyn vos Savant, American author, said: "To acquire knowledge, one must study. To acquire wisdom, one must observe." (Hat tip: Charles Kirk.) Let's hope the news items and quotes from market commentators included in the "Words from the Wise" review will assist readers of Investment Postcards to observe in order to take wise investment decisions.
That's the way it looks from Cape Town (where I am slowly starting to pack my bags for a visit to the Americas - Montevideo, Santo Domingo and San Diego - in a week's time).

Source: Jim Morin, GoComics.com, March 18, 2010.
MoneyNews: Moody's warns of risk to US, UK top debt ratings
"The United States and Britain are more likely than Germany and France to witness an embarrassing downgrade of their top debt rating, agency Moody's Investors Service said Monday.
"In a quarterly report assessing the prospects of the triple A-rated countries, including Spain and the 'less fiscally challenged' Denmark, Finland, Norway and Sweden, Moody's warned that the economic recovery remained fragile in many advanced economies.
"'This exposes governments to substantial execution risk in the implementation of their exit strategies, which could yet make their credit more vulnerable,' says Arnaud Mares, senior vice president in Moody's sovereign risk group and the main author of the report.
"Governments and central banks are looking at when and how to unwind their massive stimulus measures, which include historically-low interest rates, liquidity provisions, industry incentives and increased spending. Although some experts warn that exiting these policies too early risks creating a new economic downturn, they are also straining government finances.
"For now though, Moody's said the triple A governments don't face an immediate threat to their top ratings as the servicing of the debt remains manageable - the top credit rating reduces the interest payments countries have to pay on their debt when going to the bond markets to raise capital.
"However, debt affordability is 'most stretched' in Britain and the US, Moody's said.
"In light of the muted recovery from recession in many countries, Moody's said government action on spending and taxes is the main way of 'repairing the damage' that the global crisis inflicted on government finances.
"Moody's said triple A governments also face a 'delicate balancing act' with respect to the timing of these adjustment and that tightening fiscal policy before the recovery has become self-sustainable could risk undermining the recovery, thereby damaging governments' power to tax. However, it warned that postponing fiscal consolidation much longer is 'no less risky as it would test the patience of the market' and could force central banks to take the initiative.
"'At the current elevated levels of debt, rising interest rates could quickly compound an already complicated debt equation, with more abrupt rating consequences a possibility,' said Pierre Cailleteau, managing director of Moody's sovereign risk group."
Source: MoneyNews, March 15, 2010.
The Wall Street Journal: Rewriting Wall Street's rules
"Senator Chris Dodd is trying to push through financial regulation with an eye on consumer protection. Unlike the health-care bill, there is expected to be less partisanship, the News Hub panel reports."
Source: The Wall Street Journal, March 15, 2010.
Financial Times: Fed chief defends role as watchdog
"Ben Bernanke, chairman of the Federal Reserve, appealed to Congress to preserve the central bank's supervision of the financial system as lawmakers consider removing some of the Fed's powers.
"The Fed would lose oversight of banks with less than $50bn in assets in a bill by Chris Dodd, chairman of the Senate banking committee, which was introduced this week and will go to a mark-up next week.
"'It makes us essentially the 'too-big-to-fail' regulator,' Mr Bernanke told a congressional hearing. 'We don't want that responsibility. We want to have a connection to Main Street, as well as to Wall Street.'
"The $50bn threshold is a compromise from Mr Dodd, offered after his earlier proposal to remove all of the Fed's bank supervision was roundly rejected by the Treasury, the Fed and some senators.
"Paul Volcker, the former Fed chairman, appeared alongside Mr Bernanke to describe the idea of hiving off all of the bank's oversight as a 'grievous mistake' that would harm the conduct of monetary policy and financial stability by limiting the Fed's understanding of the financial system.
"The hearing in the House financial services committee was set up to provide a counterblast to Mr Dodd's original, more far-reaching proposal that would have moved the Fed's responsibility for 5,000 bank holding companies and 850 state-chartered banks to a single regulator. Barney Frank, chairman of the House committee, does not favour the shift in duties.
"But the Fed faces a harder challenge in preserving the entirety of its supervision, with Mr Dodd and allies on the Senate banking committee determined to hold the line, arguing that the Fed gains nothing from regulating small banks and the job would be better performed by other regulators."
Source: Tom Braithwaite, Financial Times, March 17, 2010.
The Wall Street Journal: Bernanke makes the case for Fed powers
"Fed Chairman Ben Bernanke tries to defend the central bank's role in supervising smaller banks. WSJ's David Wessel joins The News Hub to discuss."
Source: The Wall Street Journal, March 17, 2010.
MoneyNews: Stiglitz - Federal Reserve framework is corrupt
"The US Federal Reserve's framework is a corrupt one in that its regional banks are managed by board members who are officers from the very private institutions they are designed to govern, says Nobel economist Joseph Stiglitz.
"Stiglitz, also a former chief economist at the World Bank, says if a country had come to him looking for aid while running a central bank in such a manner, alarm bells would have gone off.
"'If we had seen a governance structure that corresponds to our Federal Reserve system, we would have been yelling and screaming and saying that country does not deserve any assistance, this is a corrupt governing structure,' says Stiglitz according to the Huffington Post.
"'It's time for us to reflect on our own structure today, and to say there are parts that can be improved.'
"The New York Fed presently has on its board of directors Jamie Dimon, the head of JPMorgan Chase, according to the Huffington Post.
"Lawmakers are currently negotiating a bill that would overhaul parts of the country's financial regulation."
Source: Forrest Jones, MoneyNews, March 15, 2010.
Financial Times: Fed signals optimism over US economy
"The US Federal Reserve gave a slightly more upbeat outlook for the country's economy on Tuesday, but said interest rates would remain close to zero for an 'extended period'.
"The central bank said the labour market was 'stabilising' and business spending on equipment and software has 'risen significantly'. Both descriptions marked improvements in tone compared with the previous meeting in late January.
"Despite the progress, however, Fed policymakers signalled no change in the central bank's monetary policy stance, with interest rates set to remain at their current 0-0.25 per cent range for the time being.
"Economists said this suggested there was still nervousness within the Fed about the strength of the recovery - and confidence that inflation would not pose a threat soon.
"'The data flow has been on the positive side,' said Ethan Harris, an economist at BofA Merrill Lynch. 'But the Fed needs to see something more fundamental in the economy to start hiking rates. The current path is not enough.'
"Ben Bernanke, Fed chairman, has been treading a careful line between signalling the central bank's readiness to tighten monetary policy as the economy recovers and insisting that conditions are not yet ripe for such a move.
"'The actions of the Fed leadership signal a strong aversion to repeating the premature tightening mistakes of US central bankers in the 1930s or Japanese central bankers earlier this decade,' said Michael Feroli, economist at JPMorgan.
"In a recent speech, Charles Evans, Chicago Fed president, indicated that the reference to low rates for an 'extended period' meant keeping them at the current level for the next three to four meetings - or until at least August or September.
"Thomas Hoenig, the Kansas City Fed president, dissented from the majority for a second consecutive Federal Open Market Committee meeting."
Source: James Politi, Alan Rappeport and Michael Mackenzie, Financial Times, March 16, 2010.
MoneyNews: Pimco - end of Fed mortgage program is credit tightening
"The end of the Federal Reserve's program of purchasing $1.25 trillion of mortgage-backed securities at the end of March is a form of tightening monetary policy, the chief of the largest US bond fund manager said on Tuesday.
"Mohamed El-Erian, chief executive and co-chief investment officer of Pacific Investment Management Co., or Pimco, said the end of the Fed's mortgage program, one of the US central bank's major support programs, signals a form of credit tightening.
"The Federal Reserve Open Market Committee's statement on Tuesday 'met market expectations on the three key aspects of leaving interest rates unchanged, maintaining dovish language about future policy moves and allowing the special programs to lapse,' El-Erian told Reuters.
"By the end of March, the Fed plans to have bought $1.25 trillion worth of mortgage-backed securities and about $175 billion worth of agency debt - a process economists and investors have called 'quantitative easing'.
"The unwind of the program weans the US economy from government support at a time when the Fed believes the recovery is gathering some strength."
Source: MoneyNews, March 17, 2010.
Asha Bangalore (Northern Trust): Effective federal funds rate is moving closer to target federal funds rate
"The effective federal funds rate as of March 16 was 0.20%, matching the reading of the previous day. The spread between the upper limit of the target federal funds rate and the effective federal funds rate has been a subsidy that the Fed enabled to allow banks to earn a few basis points to strengthen their balance sheets. This opportunity to borrow in the federal funds market at the effective rate and earn the target rate by depositing at the Fed is gradually vanishing.
"The effective federal funds rate has hovered around 11 and 13 basis points in the October 2009-February2010 period. In the first two weeks of March it moved up to 15 basis points. It appears that the effective federal funds rate is heading toward the upper limit of the target rate in the next few weeks. The main implication is that the Fed is removing another accommodative emergency measure."

Source: Asha Bangalore, Northern Trust - Daily Global Commentary, March 17, 2010.
Bloomberg: Money rates rising hint Treasury losses amid Fed exit
"Money market interest rates at five-month highs show the Federal Reserve is laying the groundwork to siphon a record $1 trillion in excess cash from the banking system and sending a bearish signal on Treasuries.
"Overnight federal funds rates rose to the highest since September and the cost to dealers to borrow and lend US securities for one day more than doubled in the past month. Three-month Treasury bill rates rose last week to the highest since August.
"The rise is a sign traders are preparing for tighter monetary policy as stimulus measures end. In the three months before the Fed started raising borrowing costs in June 2004, 10-year Treasury yields rose about 0.75 percentage point as bond prices fell. While higher rates mean increased borrowing costs for President Barack Obama, they also show growing confidence that the economic recovery is gaining traction.
"'The Fed is definitely getting its ducks in a row,' said Mark MacQueen, a partner at Austin, Texas-based Sage Advisory Services Ltd., which oversees $7.5 billion. 'There is no doubt that in the early phases of the Fed's plan, the Treasury market could suffer.'"
Source: Liz Capo McCormick and Daniel Kruger, Bloomberg, March 15, 2010.
MoneyNews: Roubini - US in danger of double dip recession
"The US economy is in danger of falling back into recession, as illustrated by recent weak statistics and thanks to Europe's debt crisis, says economist Nouriel Roubini.
"In the executive summary of a report for clients of his firm Roubini Global Economics (RGE), Roubini writes, 'A slew of poor economic data over the past two weeks suggests that the US economy in 2010 is headed for - at best - a U-shaped recovery.'
"The figures for consumer confidence, home sales, construction and employment suggest gross domestic product, or GDP, growth could fall well short of RGE's already anemic forecast of 2.7 percent for the first half of the year.
"'With the positive effects of the historic levels of fiscal stimulus due to fade this year, the US faces at best a 1.5 percent growth rate in H2 (the second half), which looks too close for comfort to a tipping point of a double-dip,' Roubini writes.
"Europe's debt crisis puts the euro zone at risk of re-entering recession too, he says.
"And even if that doesn't occur, Europe's slumping demand will hurt US exports."
Source: Dan Weil, MoneyNews, March 16, 2010.
Asha Bangalore (Northern Trust): Index of Leading Indicators - projection of economic growth remains in intact
"The Conference Board's Index of Leading Economic Indicators (LEI) increased 0.1% in February after a 0.3% increase in the prior month. On a year-to-year basis, the January-February average shot up 9.6%, which exceeds the high recorded in the 2001-2007 expansion. The main takeaway is that projections of economic growth remain in place. At the same time, the six-month annualized change shows a moderating trend (8.9% increase in February vs. 12.8% gain during six months ended September 2009).
"In February, real money supply (forecast) and interest rate spread made the largest positive contributions in addition to smaller growth recorded for supplier deliveries and new orders for consumer durables. The remaining six components were decliners - consumer expectations, initial jobless claims, factory workweek, building permits, orders of non-defense capital goods, and stock prices."
Source: Asha Bangalore, Northern Trust - Daily Global Commentary, March 18, 2010.
Asha Bangalore (Northern Trust): Factory production declined, weather may have played a role
"Industrial production moved up only 0.1% in February following a string of strong gains since July 2009. The February gain is, in fact, the smallest increase in the last eight months. The Fed indicated that bad weather in February could have trimmed the pace of production. Excluding the increase in the mining and utilities components, factory production slipped 0.1% in February.

"The operating rate of the nation's industries moved up slightly in February to 72.7% from 72.5% in January. The noticeably low operating rate of the factory sector suggests that investment in new projects is unlikely in the near term, with replacement demand accounting for the increase in capital spending."
Source: Asha Bangalore, Northern Trust - Daily Global Commentary, March 15, 2010.
Asha Bangalore (Northern Trust): Total continuing claims persist at high level
"Initial jobless claims declined 5,000 to 457,000 during the week ended March 13. Continuing claims, which lag initial jobless claims by one week, move up 12,000 to 4.579 million and the insured unemployment rate held steady at 3.5%. Total continuing claims inclusive of unemployment insurance claims under special programs are a better measure to get a sense of softness in the labor market. Total continuing claims were reported as 10.6110 million for the week ended February 27, marking the twelfth consecutive weekly reading in excess of 10 million. This persistence of total continuing claims at an elevated level is of significant concern for policy makers."

Source: Asha Bangalore, Northern Trust - Daily Global Commentary, March 18, 2010.
Asha Bangalore (Northern Trust): Housing market update - Mortgage Purchase Index
"Housing market news has been grim in the past two months, despite attractive mortgage rates and the $8,000 first-time home buyer tax credit program. The Mortgage Purchase Index of the Mortgage Bankers Association fell slightly to 221.5 during the week ended March 12 from 226.8 in the prior week. The Mortgage Refinance Index declined to 2,649.1 from 2,669.0 during the same period. The Mortgage Purchase Index has failed to move up meaningfully in the first three months of 2010."

Source: Asha Bangalore, Northern Trust - Daily Global Commentary, March 17, 2010.
Asha Bangalore (Northern Trust): Decline of Housing Market Index is troubling
"The Housing Market Index (HMI) of the National Association of Home Builders slipped to 15 in March from 17 in the prior month. On a quarterly basis, the HMI has dropped for two consecutive quarters. Indexes measuring home sales during the next six months (24 vs. 27 in February) and traffic of prospective buyers (10 vs. 12 in February) fell, casting a shadow on the housing market."

Source: Asha Bangalore, Northern Trust - Daily Global Commentary, March 15, 2010.


