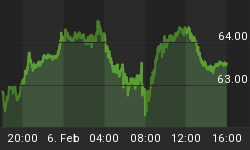
Here we are again, with the 30 year US Treasury market testing support zones, and standing at the cliff's edge. The long bond has rolled over sharply in the past few days and dropped right into support on the weekly and monthly charts. Let's start with the daily chart below reflecting a price reversal from a consolidation pattern.

In the above chart, I've added in my own Elliott Wave count the way it looks to my eyes. It's a bearish view of the bond market, and from the bottom of A or 1 the bond market has gone dead sideways so far in a consolidation structure. That's a classic continuation type pattern you see in waves 2, 4, or B. So the price form is hinting at lower prices so far.
The weekly chart below reflects a potential head and shoulder's top pattern, and waiting for a price break down for confirmation. The RSI and MACD are trying to roll over, which one should expect to confirm a break down from the current pattern.

Below is the monthly chart of the long bond. It's been in an upward channel for 3 decades and standing at the cliff's edge. Actually, it's at one of the two support channel lines. The monthly MACD is still heading lower and hasn't crossed the zero line, so there's plenty of room for the MACD to move lower confirming a price break down from these levels.

What's really interesting is the neckline of the head and shoulder's pattern on the weekly chart is about the same price as the support channel line on the monthly chart. So, a price break down could easily confirm the head and shoulder's pattern and the channel is finished, which should usher in a more significant correction in long bond prices over time.
All that's missing is the confirmation move down. The world is not ready for this correction or its implication, which I believe will be wide spread and diverse. This and this alone is the most important chart in my mind to follow and something worth keeping an eye on these days as prices are very close to a significant technical signal.
Hope all is well.


