


Prices were essentially flat for the past week as the markets traded in a sideways pattern on low volume. By the end of the week, indicators were flashing a short term sell signal and a probable reversal of the up trend which started on 5/12.
In last week's letter, the Summary read: "The stock market appears ready for a short phase of consolidation before moving higher." Under Cycles, it said: "There is also a short term cycle low due in about two weeks which will eventually act as a restraining factor on the short term trend..." I believe that this is what is currently taking place.
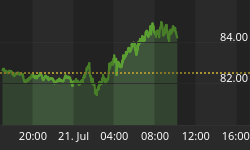
Let's analyze the hourly chart of the S&P500 which appears below. It will give us a wealth of information as to the current position of the stock market, both short term and intermediate.

First, you will note that just before every short term trend reversal occurred, it was preceded by the bottom indicator diverging from the price. (The dashed vertical lines represent negative divergence and the dotted lines positive divergence.) Since this has just occurred once again, the short term up trend has probably come to an end. Consequently we should expect some downside action for the next few days, and this would be in line with the comments reproduced from last week's letter. Note also that this is a logical place for prices to reverse as they found overhead resistance at the down trend line connecting the two tops.
The chart also tells us something about the intermediate term trend consolidation which started in early March.
Notice that this is a 3 wave pattern, or a typical A-B-C corrective pattern. Notice also how the C wave, although it is approximately equal in length to the A wave, does not represent acceleration to the downside. And now, price action is challenging the intermediate down trend line (solid) as well as the .382 speed resistance line (dotted). If these trend lines are penetrated decisively and the 1150 level is exceeded, one can conclude that the correction is probably over and that the up trend has resumed. I say "probably" because the tone of the rally will also need to confirm this; something that we cannot know until it happens. As you will see below, there is compelling technical evidence that a reversal to the up side is about to take place.
Looking at other aspects of the market, the leading indicators GE and the QQQ did not confirm, albeit by a small margin, the final highs of the SPX on Friday, and the Dow Transports short term strength is not being confirmed by the Industrials. These are other indications that we have arrived at the end of a short term up trend.
Momentum: Other hourly indicators are confirming a short term top, but the daily indicators are only slightly overbought and do not call for a severe decline at this time. This is a positive for the intermediate trend.
Fibonacci: We are still looking for the 4th week of the month to be the turning point, although it could come earlier.
Since prices progress through Fibonacci relationships, every small and large reversal of trend begins a new sequence. both on a daily and weekly basis. Keeping track of all these sequences is a hopeless task, especially since one never knows just how significant the likely reversal is going to be. However, current additional market data suggests that we should pay close attention to the price action between the middle and the end of this month.
Now, for the most intriguing part of our analysis:
The McClellan oscillator is finally pulling back from record setting positive levels! This pull-back is not only normal, but expected since it had achieved an extremely overbought condition.
The New Highs and New Lows index continues to act well, as new lows have dried up and new highs have steadily improved in number.
Two other indicators that are also giving exceptionally strong positive readings are the Put/Call ratio which just hit a level not seen since the major lows of October 2002 and March 2003, and the NYSE Member buying which has just hit a new all-time high!
Summary: Arguments are being made that the McClellan, the Put/Call ratio and the NYSE Member buying are somehow distorted and not giving reliable readings. That may be, but it would be unwise to ignore them since, when taken at face value, they suggest that under the current sluggish price action some important accumulation is taking place, and that we should logically expect a strong resurgence of the up trend. This action should take place before the end of the month after the short term cycle has made its low and we get past the Fibonacci date mentioned above.
Is it possible that not one, but all three of these historically reliable indicators are giving us false signals? We'll know shortly whether these unusual readings are real or sham.
Fundamentals vs. Technicals
I have never trusted my ability do determine the impact of economic fundamentals on the stock market. Too many times I have seen it sell off on good data, or "climb a wall of worry" when bad news abounded. This is also the case when it comes to geopolitical events. There often seems to be a disconnect!
The stock market has a mind and a logic of its own. It represents the collective decision making process of millions of investors throughout the world acting as individuals with their own reasons, agendas, and motivations for buying or selling securities. Every minute of the day all this information is distilled and converted in an up-to-the-minute final price value. What could be more "fundamental" than that?
It makes sense, therefore, to favor technical analysis over fundamental analysis. But becoming a good technical analyst requires intensive study. One must develop a thorough understanding of market behavior and of the technical tools that predict this behavior. More importantly, one must develop the ability to interpret those tools objectively and not use them to substantiate one's own predetermined views. Finally, one will probably also have to develop some intuitive faculty which goes beyond mere intellect, in order to get a "feel" for what is likely to happen next! This is not something that one acquires overnight!
In summary, fundamental analysis deals with what the market should do, while technical analysis scrutinizes what it is actually doing.


