


After having just stating in an interview earlier this week that although many banks are probably guilty of what Lehman was caught doing with Repo 105's pursuing those actions based upon semantics may be fruitless (it may be called depo 106?), Reuters comes out with this interesting story: Major US banks masked risk levels: report
(Reuters) - Major U.S. banks temporarily lowered their debt levels just before reporting in the past five quarters, making it appear their balance sheets were less risky, the Wall Street Journal said, citing data from the Federal Reserve Bank of New York.
The paper said on Friday 18 banks, including Goldman Sachs Group <GS.N>, Morgan Stanley <MS.N>, J.P. Morgan Chase <JPM.N> Bank of America <BAC.N> and Citigroup <C.N>, understated the debt levels used to fund securities trades by lowering them an average of 42 percent at the end of each period.
The banks had increased their debt in the middle of successive quarters, it said.
Citi, Bank of America, Goldman Sachs, JPMorgan Chase and Morgan Stanley were not immediately available for comment when contacted by Reuters outside regular U.S. business hours.
Excessive leverage by the banks was one of the causes that led to the global financial crisis in 2008.
Due to the credit crisis, banks have become more sensitive about showing high levels of debt and risk, worried their stocks and credit ratings could be punished, the Journal said.
Federal Reserve Bank of New York could not be immediately reached for comment by Reuters.
The Wall Street Journal (see their interactive model) and ZeroHedge broke a similar storty with some meat behind it to justify the allegations. Ahhh!!! The return of real reporting, and not just from blogs!
From ZH:

Hmmm... It appears as if this report should have been published in conjunction with that interview I just gave on regarding the prevalence of the Lehman Chicanery in the entire banking system!
Please excuse the sound. I was coming off of a very bad cold, which caused me to lose my voice very early on in the interview.
Let's revisit some of the risks still inherent in the big banrks' balance sheets...
Goldman Sachs:
Still has a bunch of trash on its balance sheet, see Reggie Middleton vs Goldman Sachs, Round 2. If you look at the period of the most recent credit bubble, Goldman did everything that the other failed and bailed out banks did: leveraged up on trash assets, invested in and sold the worthless junk, and ran to the government for aid and bailouts:
So, what is GS if you strip it of its government protected, name branded hedge fund status. Well, my subscribers already know. Let' take a peak into one of their subscription documents (
Goldman Sachs Stress Test Professional 2009-04-20 10:06:45 4.04 Mb - 131 pages). I believe many with short term memory actually forgot what got this bank into trouble in the first place, and exactly how it created the perception that it got out of trouble. The (Off) Balance Sheet!!!
Contrary to popular belief, it does not appear that Goldman is a superior risk manager as compared to the rest of the Street. They may the same mistakes and had to accept the same bailouts. They are apparently well connected though, because they have one of the riskiest balance sheet compositions around yet managed to get themselves insured and protected by the FDIC like a real bank. This bank's portfolio looked quite scary at the height of the bubble.

As a matter of fact, it looks just as scary today as it does at the height of the bubble, but since very few people read balance sheets, no one really notices.

You know what most people don't realize is that it looks quite scary now as well.

JP Morgan:
Excerpted from Reggie Middleton on JP Morgan's "Blowout" Q4-09 Results - Credit conditions continue to remain tough as the delinquency rates continue to climb and NPAs remain at elevated levels. The 30 day+ delinquency rates for the consumer lending rose to 5.93% in 4Q09 from 5.85% in 3Q09 and 4.21% in 4Q08. The 30 days+ delinquency rates for credit card touched 6.28% in 4Q09 against 5.99% in 3Q09 and 4.97% in 4Q08.

Non performing loans increased to 2.77% of total loans at the end of 4Q09 from 2.72% of total loans at the end of 2Q09.


As clearly foretold last year, JP Morgan is significantly understating the potential for losses on its WaMu portfolio acquisition
We looked into acquired portfolio of Wamu and as analyzed in the forensic report, owing to continuous deterioration in the credit quality, the acquisition is proving to be a bad deal for JPM. Exactly one year ago, I accused JP Morgan of taking unrealistic marks on the WaMu portfolio, see Is JP Morgan Taking Realistic Marks on its WaMu Portfolio Purchase? Doubtful! It appears as if I was right on the mark, despite management proclaiming that the loss trend on those loans are going as expected. If that was the case, why is the discount and loss buffer already eaten through to provide material net losses - just one year after the purchase??? The Alt-A/Option ARM/HELOC pain has yet to really hit, and JPM is already in the red by about 5% on this deal and they bought it at a 25% discount! I suggest all readers reference the loss trends in the Alt-A market as of December (A Fundamantal Investor's Peek into the Alt-A Market) and paying subscribers should download the worksheet behind the data to get a granular view of what is going on. We are already at a charge-off rate of near 30%, which will not be reflected in JPM's numbers until next quarter, and I have reason to believe that the WaMu loans will perform worse than average.
As per the last forensic report at the end of 2Q09, the implied discount rate for purchased credit impaired loans stood at 22.9% while delinquency rate was 23.4%, thus a negative buffer of 0.5%. In 3Q09, this negative buffer has further worsened to 2.6%, due to an increase in delinquency rate to 25.6% reflecting continuous deterioration in the acquired portfolio. Moreover, for 4Q09 the delinquency rate has increased further to 27.8% and though the company has not reported the outstanding balance and carrying value numbers we believe that the buffer for 4Q09 will decline further.


In light of expected loan losses from the acquired portfolio, JPM is adding to the allowance for loan losses. In 4Q09, JPM added nearly $491 million to allowance for loan losses to cover the estimated deterioration in the Washington Mutual purchased credit-impaired portfolio; this is compared with no addition in the same quarter last year and nearly $1.1 billion addition in 3Q09.
Morgan Stanley:
Morgan Stanley, appears to have reacquired the title of the "Riskiest Bank on the Street" with increasing VaR and declining risk adjusted returns that reflect growing risk in its investment portfolio, which is rife with assets that I am quite bearish on.
Morgan Stanley's aggregate trading and non-trading VaR continued to increase in 3Q09, reaching $168 mn with the risk adjusted return on capital (RAROC) continuously declining to 22.9% in 3Q09.

The latest update for all subscribers: ![]() Morgan Stanley Forensic Outlook: Q1 2010 2010-01-05 04:20:36 504.53 Kb
Morgan Stanley Forensic Outlook: Q1 2010 2010-01-05 04:20:36 504.53 Kb
Free Research: The Riskiest Bank on the Street
Hey, it's all cool. It's not as if they are reliant on each other to offset these risks, right????
As a result, we have looked into derivative exposure of top commercial banks to determine if they are hedging with each other to an extent that engenders systemic risk. We have sourced the data from OCC report (attached for your reference, see ![]() occ_q1_2009_derivatives 10/09/2009,01:37 190.49 Kb). Overall derivative products in U.S have grown at a staggering pace rising from $41 trillion by 2000 year end to $202 trillion, or nearly 14.0x of U.S GDP as of March 31, 2009. Of the $202.0 trillion notional value of derivatives in United States, top 5 banks alone account for 96% of the total industry notional amount The high concentration of derivatives among the top five players strongly suggest (this actually being politically correct, realistically it practically assures us) that they may be subject to extreme levels of counterparty risk towards each other. JPM is the largest player in derivative markets accounting for approximately 40% of total notional value of derivatives in U.S. JPM's notional value of derivatives as of March 31, 2009 stood at 39.0 times its total assets and 959 times its tangible equity.
occ_q1_2009_derivatives 10/09/2009,01:37 190.49 Kb). Overall derivative products in U.S have grown at a staggering pace rising from $41 trillion by 2000 year end to $202 trillion, or nearly 14.0x of U.S GDP as of March 31, 2009. Of the $202.0 trillion notional value of derivatives in United States, top 5 banks alone account for 96% of the total industry notional amount The high concentration of derivatives among the top five players strongly suggest (this actually being politically correct, realistically it practically assures us) that they may be subject to extreme levels of counterparty risk towards each other. JPM is the largest player in derivative markets accounting for approximately 40% of total notional value of derivatives in U.S. JPM's notional value of derivatives as of March 31, 2009 stood at 39.0 times its total assets and 959 times its tangible equity.
This will never blow up again, will it? Of course, not for at least a couple of months until Europe roils the FICC markets: The Next Step in the Bank Implosion Cycle???
The amount of bubbliciousness, overvaluation and risk in the market is outrageous, particularly considering the fact that we haven't even come close to deflating the bubble from earlier this year and last year! Even more alarming is some of the largest banks in the world, and some of the most respected (and disrespected) banks are heavily leveraged into this trade one way or the other. The alleged swap hedges that these guys allegedly have will be put to the test, and put to the test relatively soon. As I have alleged in previous posts (As the markets climb on top of one big, incestuous pool of concentrated risk... ), you cannot truly hedge multi-billion risks in a closed circle of only 4 counterparties, all of whom are in the same businesses taking the same risks.

So, How are Banks Entangled in the Mother of All Carry Trades?
Trading revenues for U.S Commercial banks have witnessed robust growth since 4Q08 on back of higher (although of late declining) bid-ask spreads and fewer write-downs on investment portfolios. According to the Office of the Comptroller of the Currency, commercial banks' reported trading revenues rose to a record $5.2 bn in 2Q09, which is extreme (to say the least) compared to $1.6 bn in 2Q08 and average of $802 mn in past 8 quarters.

High dependency on Forex and interest rate contracts
Continued growth in trading revenues on back of growth in overall derivative contracts, (especially for interest rate and foreign exchange contracts) has raised doubt on the sustainability of revenues over hear at the BoomBustBlog analyst lab. According to the Office of the Comptroller of the Currency, notional amount of derivatives contracts of U.S Commercial banks grew at a CAGR of 20.5% to $203 trillion by 2Q-09 from $87.9 trillion in 2004 with interest rate contracts and foreign exchange contracts comprising a substantial 84.5% and 7.5% of total notional value of derivatives, respectively. Interest rate contracts have grown at a CAGR of 20.1% to $171.9 trillion between 4Q-04 to 2Q-09 while Forex contracts have grown at a CAGR of 13.4% to $15.2 trillion between 4Q-04 to 2Q-09.
In terms of absolute dollar exposure, JP Morgan has the largest exposure towards both Interest rate and Forex contracts with notional value of interest rate contracts at $64.6 trillion and Forex contracts at $6.2 trillion exposing itself to volatile changes in both interest rates and currency movements (non-subscribers should reference An Independent Look into JP Morgan, while subscribers should reference ![]() JPM Report (Subscription-only) Final - Professional, and
JPM Report (Subscription-only) Final - Professional, and ![]() JPM Forensic Report (Subscription-only) Final- Retail). However, Goldman Sachs with interest rate contracts to total assets at 318.x and Forex contracts to total assets at 11.2x has the largest relative exposure (see
JPM Forensic Report (Subscription-only) Final- Retail). However, Goldman Sachs with interest rate contracts to total assets at 318.x and Forex contracts to total assets at 11.2x has the largest relative exposure (see ![]() Goldman Sachs Q2 2009 Pre-announcement opinion 2009-07-13 00:08:57 920.92 Kb,
Goldman Sachs Q2 2009 Pre-announcement opinion 2009-07-13 00:08:57 920.92 Kb, ![]() Goldman Sachs Stress Test Professional 2009-04-20 10:06:45 4.04 Mb,
Goldman Sachs Stress Test Professional 2009-04-20 10:06:45 4.04 Mb, ![]() Goldman Sachs Stress Test Retail 2009-04-20 10:08:06 720.25 Kb,). As subscribers can see from the afore-linked analysis, Goldman is trading at an extreme premium from a risk adjusted book value perspective.
Goldman Sachs Stress Test Retail 2009-04-20 10:08:06 720.25 Kb,). As subscribers can see from the afore-linked analysis, Goldman is trading at an extreme premium from a risk adjusted book value perspective.

As a result of a surge in interest rate and Forex contracts, dependency on revenues from these products has increased substantially and has in turn been a source of considerable volatility to total revenues. As of 2Q-09 combined trading revenues (cash and off balance sheet exposure) from Interest rate and Forex for JP Morgan stood at $2.4 trillion, or 9.5% of the total revenues while the same for GS and BAC (subscribers, see ![]() BAC Swap exposure_011009 2009-10-15 01:02:21 279.76 Kb) stood at $(196) million and $433 million, respectively. As can be seen, Goldman's trading teams are not nearly as infallible as urban myth makes them out to be.
BAC Swap exposure_011009 2009-10-15 01:02:21 279.76 Kb) stood at $(196) million and $433 million, respectively. As can be seen, Goldman's trading teams are not nearly as infallible as urban myth makes them out to be.

Although JP Morgan's exposure to interest rate contracts has declined to $64.5 trillion as of 2Q09 from $75.2 trillion as of 3Q07, trading revenues from Interest rate contracts (cash and off balance sheet position) have witnessed a significant volatility spike and have increased marginally to $1,512 in 2Q09 compared with $1,496 in 3Q07. Although JPM's Forex exposure has decreased from its peak of $8.2 trillion in 3Q08, at $3.2 trillion in 2Q09 the exposure is still is higher than 3Q07 levels. Even for Bank of America and Citi , the revenues from Interest rate and forex products have been volatile despite a moderate reduction in overall exposure. With top 5 banks having about 97% market share of the total banking industry notional amounts as of June 30, 2009, the revenues from trading activities for these banks are practically guaranteed to be highly volatile in the event of significant market disruption - a disruption aptly described by the esteemed Professor Roubini as a rush to the exit in the "Mother of All Carry Trades" as the largest macro experiment in the history of this country starts to unwind, or even if the participants in this carry trade think it is about to start to unwind.
The table below shows the trend in trading revenues from Interest rate and Forex positions for top banks in U.S.

Banks exposure to interest rate and foreign exchange contracts
With volatility in currency markets exploding to astounding levels (with average EUR-USD volatility of 16.5% over the past year (September 2008-09) compared to 8.9% over the previous year), commercial and investment banks trading revenues are expected to remain highly unpredictable. This, coupled with huge Forex and Interest rate derivative exposure for major commercial banks, could trigger a wave of losses in the event of significant market disruptions - or a race to the exit door of this speculative carry trade. Additionally most of these Forex and Interest rate contracts are over-the-contract (OTC) contracts with 96.2% of total derivative contracts being traded as OTC. This means no central clearing, no standardization in contracts, the potential for extreme opacity in pricing, diversity in valuation as well as a dearth of liquidity when it is most needed - at the time when everyone is looking to exit. Goldman Sachs has the largest OTC traded contracts with 98.5% of its derivative contracts traded over the counter. With the 5 largest banks representing 97% of the total banking industry notional amount of derivatives and most of these contracts being traded off exchange, the effectiveness of derivatives as a hedging instrument raises serious questions since most of these banks are counterparty to one another in one very small, very tight circle (see the free article, "As the markets climb on top of one big, incestuous pool of concentrated risk... ").


Of course, there is no real reason to expect volatility and surprises in the Euro and Euro-denominated debt, right? There'll be no unpleasant surprises coming out of that region, for sure!
The Pan-European Sovereign Debt Crisis, to date (free to all):
- The Coming Pan-European Sovereign Debt Crisis - introduces the crisis and identified it as a pan-European problem, not a localized one.
- What Country is Next in the Coming Pan-European Sovereign Debt Crisis? - illustrates the potential for the domino effect
- The Pan-European Sovereign Debt Crisis: If I Were to Short Any Country, What Country Would That Be.. - attempts to illustrate the highly interdependent weaknesses in Europe's sovereign nations can effect even the perceived "stronger" nations.
- The Coming Pan-European Soverign Debt Crisis, Pt 4: The Spread to Western European Countries
- The Depression is Already Here for Some Members of Europe, and It Just Might Be Contagious!
- The Beginning of the Endgame is Coming???
- I Think It's Confirmed, Greece Will Be the First Domino to Fall
- Smoking Swap Guns Are Beginning to Litter EuroLand, Sovereign Debt Buyer Beware!
- Financial Contagion vs. Economic Contagion: Does the Market Underestimate the Effects of the Latter?
- "Greek Crisis Is Over, Region Safe", Prodi Says - I say Liar, Liar, Pants on Fire!
- Germany Finally Comes Out and Says, "We're Not Touching Greece" - Well, Sort of...
- The Greece and the Greek Banks Get the Word "First" Etched on the Side of Their Domino
- As I Warned Earlier, Latvian Government Collapses Exacerbating Financial Crisis
- Once You Catch a Few EU Countries "Stretching the Truth", Why Should You Trust the Rest?
- Lies, Damn Lies, and Sovereign Truths: Why the Euro is Destined to Collapse!
- Ovebanked, Underfunded, and Overly Optimistic: The New Face of Sovereign Europe
- Moody's Follows Suit Behind Our Analysis and Downgrades 4 Greek Banks
- The EU Has Rescued Greece From the Bond Vigilantes,,, April Fools!!!
- How BoomBustBlog Research Intersects with That of the IMF: Greece in the Spotlight
- Grecian News and its Relevance to My Analysis
The table below compares interest rate contracts and foreign exchange contracts for JPM, GS, Citi, BAC and WFC.
JP Morgan has the largest exposure in terms of notional value with $64,604 trillion of notional value of interest rate contracts and $6,977 trillion of notional value of foreign exchange contracts. In terms of actual risk exposure measured by gross derivative exposure before netting of counterparties, JP Morgan with $1,798 bn of gross derivative receivable, or 21.7x of tangible equity, has the largest gross derivative risk exposure followed by Bank of America ($1,760 bn, or 18.1x). Bank of America with $1,393 bn of gross derivatives relating to interest rate has the highest exposure towards interest rate sensitivity while JP Morgan with $154 bn of Foreign exchange contracts has the highest exposure from currency volatility. We have explored this in forensic detail for subscribers, and have offered a free preview for visitors to the blog: (![]() JPM Public Excerpt of Forensic Analysis Subscription2009-09-18 00:56:22 488.64 Kb), which is free to download, and
JPM Public Excerpt of Forensic Analysis Subscription2009-09-18 00:56:22 488.64 Kb), which is free to download, and ![]() JPM Report (Subscription-only) Final - Professional, or
JPM Report (Subscription-only) Final - Professional, or ![]() JPM Forensic Report (Subscription-only) Final- Retail as well as a free blog article on BAC off balance sheet exposure If a Bubble Bubble Bursts Off Balance Sheet, Will Anyone Be There to Hear It?: Pt 3 - BAC).
JPM Forensic Report (Subscription-only) Final- Retail as well as a free blog article on BAC off balance sheet exposure If a Bubble Bubble Bursts Off Balance Sheet, Will Anyone Be There to Hear It?: Pt 3 - BAC).


Subscribers, see ![]() WFC Research Note Sep 2009 2009-09-30 13:01:30 281.29 Kb, ~
WFC Research Note Sep 2009 2009-09-30 13:01:30 281.29 Kb, ~ ![]() WFC Off Balance Sheet Exposure 2009-10-19 04:25:53 258.77 Kb ~
WFC Off Balance Sheet Exposure 2009-10-19 04:25:53 258.77 Kb ~ ![]() WFC Investment Note 22 May 09 - Retail 2009-05-27 01:55:50 554.15 Kb ~
WFC Investment Note 22 May 09 - Retail 2009-05-27 01:55:50 554.15 Kb ~ ![]() WFC Investment Note 22 May 09 - Pro 2009-05-27 01:56:54853.53 Kb ~
WFC Investment Note 22 May 09 - Pro 2009-05-27 01:56:54853.53 Kb ~ ![]() Wells Fargo ABS Inventory 2008-08-30 06:40:27 798.22 Kb to expound on our opinions of Wells Fargo, bel
Wells Fargo ABS Inventory 2008-08-30 06:40:27 798.22 Kb to expound on our opinions of Wells Fargo, bel
A Must Read: An Independent Look into JP Morgan. This contains the "public preview" document (![]() JPM Public Excerpt of Forensic Analysis Subscription 2009-09-18 00:56:22 488.64 Kb), which is free to download.
JPM Public Excerpt of Forensic Analysis Subscription 2009-09-18 00:56:22 488.64 Kb), which is free to download.
- JPM Report (Subscription-only) Final - Professional
- JPM Forensic Report (Subscription-only) Final- Retail
Notice how all of the banks on this list probably have at least 100% of their tangible equity exposed through counterparty exposure to, at the most, 5 other highly concentrated, highly correlated and highly incestuous counterparties. Most of the banks have between 12 and 20 times their tangible equity concentrated into this close knit pool. That, my friends, is excessive risk waiting to implode. I am sure there are some of you saying "Well, you don't know that they are actually using each other as counterparties". Yeah, right! Who the hell else would they be using? Tell me what group of companies will be able to absorb $4.1 trillion dollars (That's TRILLION with a "T" of MARKET VALUE carried on the balance sheet, NOT notional value) of counterparty risk???

Cute graphic above, eh? There is plenty of this in the public preview. When considering the staggering level of derivatives employed by JPM, it is frightening to even consider the fact that the quality of JPM's derivative exposure is even worse than Bear Stearns and Lehman's derivative portfolio just prior to their fall. Total net derivative exposure rated below BBB and below for JP Morgan currently stands at 35.4% while the same stood at 17.0% for Bear Stearns (February 2008) and 9.2% for Lehman (May 2008). We all know what happened to Bear Stearns and Lehman Brothers, don't we??? I warned all about Bear Stearns (Is this the Breaking of the Bear?: On Sunday, 27 January 2008) and Lehman ("Is Lehman really a lemming in disguise?": On February 20th, 2008) months before their collapse by taking a close, unbiased look at their balance sheet. Both of these companies were rated investment grade at the time, just like "you know who".
Of course, JPM is not in this by themselves, they just lead the pack of the derivative risk mongers:
| Company | Notional Value of derivatives | % of Total Notional Value | Implied market value using JPM's actual as template | Implied hedged amount using JPM's actual as template | Total Assets | Notional Value of derivatives / Total Assets | Tangible Equity | Notional Value of derivatives / Tangible Equity | Implied Counterparty Exposure of Derivatives as Multiple of Tangible Equity |
| JPMORGAN CHASE & CO. | 81,161 | 40.2% | 1,798 | 1,700.05 | 2,079 | 39.0x | 84.65 | 958.8x | 20.1x |
| BANK OF AMERICA CORPORATION | 38,864 | 19.2% | 861 | 814.06 | 2,323 | 16.7x | 65.66 | 591.9x | 12.4x |
| GOLDMAN SACHS GROUP, INC., THE | 39,928 | 19.8% | 884 | 836.34 | 926 | 43.1x | 41.91 | 952.7x | 20.0x |
| CITIGROUP INC. | 29,619 | 14.7% | 656 | 620.41 | 1,823 | 16.3x | 29.67 | 998.4x | 20.9x |
| WELLS FARGO & COMPANY | 1,870 | 0.9% | 41 | 39.17 | 1,286 | 1.5x | 30.33 | 61.6x | 1.3x |
| HSBC NORTH AMERICA HOLDINGS INC. | 3,454 | 1.7% | 76 | 72.35 | 402 | 8.6x | 66.23 | 52.1x | 1.1x |
| Total | 201,964 | 100.0% | 4,316.48 | 4,082.37 |
** JPM had additional collateral at the initiation of transactions of 18,500
Looking at these numbers, the Reuters article above should not be shocking at all...
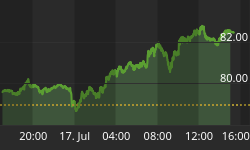
So, while the games continue to increase risk, market complacency is near a high:

As you can see, we are just about where we were in 2007 in terms of average volatility.


