


Extreme Measures: The stumbling Yankee carry trade, reflation-fueled, seems to have recovered its footing (wobbly at best), and the Fed's measured approach (possibly starting June 2004) as inflation grows, can mark a change for the worse for homebuilders and brokers before summer starts officially.
Reflation-trade favorites, like cyclical industrial metal shares, seemed to have recovered their resolve (for now), and energy-related plays (including tanker shares) and homebuilding are still going strong, but what are their prospects? Our previous and new observations about Japan continue to stir us - to see strength in their economy and in the Yen. The secular overhang of the US current account and Balance of Payments gives us pause for the US Dollar, notwithstanding the bounce we expect should continue as reflation-trades fade. The emergence of both rising interest rates and inflation is ominous for bond bull market and reflation beneficiaries like homebuilders, as mentioned in our last note, but also securities brokers. A remark from Greenspan, according to a Reuters June 8 account of the International Monetary Conference in London, echoes a misgiving expressed in our previous market note about the nature of employment growth, "The proportion of increases in temporary workers relative to total employment gains has been unusually large, suggesting that business caution remains a feature of the economic landscape." Rates will still be going up, but it seems such hikes won't be prompted by the robust employment reports we've all hoped and waited for.
To date we are watchful of industrial metal shares' revived prospects but our general view, as stated in a Feb/March 2004 note, remains and we reiterate caution. Some trend traders may see a reversal, and while entirely possible from the P.O.V. of those who dare not prognosticate, but "surf" price movements, we understand. We volunteer, however, that readers with this tack consider risk management-focused position sizing in their trades and a healthy regard for using stop losses or some other form of exit. Since our last release, these shares (e.g. PD, FCX, N, AA and AL) may have enjoyed a brief revival but we still ask our readers to consider selling into rallies - at least readers with a contrarian bent. While fears of a Chinese slowdown and an end to a revived dollar were overshadowed by energy market events, we see the tide turning back. More news may trickle out over the year regarding the effectiveness of Chinese authorities credit tightening and the ripple of the US current account and balance of payments figures will eventually resonate in the markets and weigh on the dollar. To traders who would surf any resurgence in the Yankee carry trade, we say "hang ten" and good luck.
Charts of PD, N and AA or AL since January 2004.

Phelps Dodge Shares bounce, a little

Inco shares show a little steel, for now

Alcoa shares luster still dulling
Our brief foray onto the high seas in our last note with mention of the Baltic Dry Index, continues to perturb us about energy. Perhaps we are being alarmist about a potential correction briefly interrupting the greater secular upward trend in energy and shipping. The markets tells us that energy demand will grow but the tanker index makes us wonder if a corrective phase for all overseas transport, including energy, could emerge before resuming its upward course. (Update from last issue: the OMI $640m bid for Stelmar Shipping, which would have created the third largest tanker company, is on the shelf. Stelmar management, to the mutual consternation of OMI CEO Craig Stevenson, and Stelmar (and EasyJet) founder Stelios Haji-Ioannou, decided the OMI offer wasn't in shareholders' interests. The Haji-Ioannou family, holders of 27% of Stelmar shares, did not share that view.) Trend traders may have been basking these last few weeks, if not months, with the emergence of higher energy costs. This note's "often in doubt, sometimes right" perspective, however, guides us to prepare for a brief squall during a longer-term bull trend in energy. At the same time, we cannot ignore prospects for rising secular energy demand in the emerging markets (another way of saying China really, at this moment), and the reality of capacity constraints (in the form of insufficient infrastructure supply-chain, including: exploration, post-restated and diminished actual reserves that have jarred some energy-related stock-prices, and refineries). In addition, we can point to demand for crude outside the States competing for the same barrels, and downstream constraints in US refineries, forcing imports of refined energy demand to rise. (This last matter strikes us as very concrete given the decline in refineries from just over 300 to just under half, with the last refinery completed in 1976.)
We are mindful that during the past few weeks prices were over $42 a barrel (above $39 for Brent crude), foreign workers were being killed in Saudi Arabia, there was a 10% softening in prices since our last market note, and that a general strike in Nigeria just ended (which would not have impacted Nigerian supplies, but was likely treated as relevant for news-happy traders). We are also aware of the disappointment over what has been characterized as an underwhelming June 8 OPEC production quota boost (by 2m barrels/day, followed by a 0.5m boost starting August 1) - and of the perhaps not unrelated quote of a Venezuela oil minister weeks before, on April 28 or so, "The production ceiling of OPEC is 23.5 [million barrels per day], but there is unauthorized overproduction of more than 2.5 [million barrels per day] in the market. [An increase of the production quota would] officially recognized without any increase in real output". Perhaps we should be more worried, Baltic Index notwithstanding. We can only observe and with great uncertainty about what is to come. All readers should neither attempt and presume to play "Julian Simon" and reassure everyone as to humanity's productive potential to churn out crude, nor will we presume, at the downstream end of the energy production chain, to play T. Boone Pickens, and surmise $3 plus gasoline and beyond will be in our immediate future. Our stirrings in our previous note, prompted by the Baltic Index, maybe premature, but we reiterate a modest warning. We will not fight the tide - we say again surf the markets with an eye for possible wipeout.
Everyone is expecting for the first hammer-fall, the first "measured" nail to seal the sepulcher of the bond bull market - which died at about age 23 in Chicago's bond pits. The emergence of inflation may however speed up the Fed's gradual-approach policies. The Consumer Price Inflation index (ex. Food and energy) has risen 1.1% to 1.8% over 3 months (for Jan - April 2004) and the Personal Consumer Expenditure Deflator (also ex food and energy) rose from 0.8% (Dec. 2003) to 1.4% (April 2004). Seeing as we all like and need to eat, perhaps we should consider looking at food costs, courtesy of Bureau of Labor Statistics (BLS) data. Just as the major stock indices rode upwards on reflation's back for the past year, so did the price of food. Included as well is a simple presentation of the average fuel price index chart, which we are a little reluctant to comment on, given all the variables that can move the cost of energy. It wouldn't hurt as well to notice about eight months of consecutive monthly advances in US import prices either. At the heart, or core, of our worries, is that the noncore data of price inflation is more significant to the man on the street, than to the purists who await the release of the upcoming latest CPI figures.
Rise in food costs chart of Year-Over-Year change in food prices - someCPI "NON-core" data
SOURCE: Bureau of Labor Statistics
U.S. city average Price Index for Fuel
SOURCE: Bureau of Labor Statistics
Chart of US Import Index
SOURCE: Bureau of Labor Statistics
"If it looks like [inflation] is really there, then my personal position would be that it would be appropriate for the FOMC to move further and faster - than priced in the market today." Said St. Louis Fed President William Poole, on June 10. On June 8 Greenspan had said, "Should [the measured approach] prove misplaced ... the FOMC is prepared to do what is required to fulfill our obligations to advance price stability...." Yes, time to prepare.
Job hunters cross your fingers and hope that job offer comes before your next trip in your SUV, on a fresh and pricey tank of gas, to the market for more groceries which have begin to take bigger bites out of you than the reverse. We read in the June 1 Financial Times a piece by Stephen Ceccehetti, a Brandeis University professor and research associate at the National Bureau of Economic Research, suggesting that demographics have their place in terms of inflation and the apparent paucity in hard employment outside the temporary worker variety. He suggested that today's managers, the oldest of whom on average were just college students in the mid- 1960s, may be accustomed to a "world with inflation", and may in fact be inclined to hire when they can see rising prices confirming a sense that they can believe and anticipate near-term earnings growth - enough to hire. Let us hope so.
We note the Bank of England's recent consecutive rate hikes in May and June in its repo rate, inspired partly to cool the inflation in UK housing prices. We are all expecting the same here, that asset prices, eventually, at home and abroad, will obey the same rules regarding supply and demand, and credit and liquidity. Speaking of the markets' rules working at home and abroad, let us briefly indulge our interest, indicated by our previous market notes, about Japan's recovery and the Yen. We see below a chart for the 10-year JGB, the Nikkei and lastly an updated Yen/dollar chart.
Yield on the 2-year and 10-Year JGBs
SOURCE: Asian Development Bank
Nikkei 225 Index

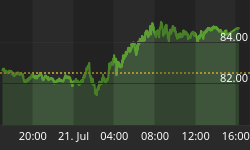
CHART for Yen/Dollar: Yen strengthens, stumbles and recovers?
Source: www.oanada.com
Is there a trend emerging for those readers who like to mark "breakouts" in their trading? We're not sure. An online visit to the Japanese MOF revealed the rise in foreign investment in bonds - perhaps reflation traders were moving on to a new trade and laying bets to enjoy an upward ride? The yield on 10 year JGBs is up, to levels last seen in late 2000/early 2001. Heizu Takenaka, economy and financial services minister, recently characterized the situation as a "positive sign", noting yields can rise for an economic recovery just as they would for a decline in the JGB's credibility with the markets. While the Nikkei at times, appears to be leading the yen by the leash these last few months, we wonder how soon a JGB short would begin to make big money.
This is either a puzzling bet bullish bet on the yen, which should sting as deflation recedes and Japan appears to be mending upward, or a hasty foxhole to dive during any retreat from Nikkei trading action. This is all the more odd with foreign investors holding something like 3% of all JGBs.
Our inner contrarian notes that while Japanese equities' balance sheets were still filled with traps and disappointments, values bought at wonderful bargains of the Warren Buffett "the early years" variety - " cigar butt" investments at a discount. We are looking for change in the Yen and see the possibility for profits. At the same time, we are also mindful of the US dollar's secular prospects, as based upon the continued cumulative growth of the current account and balance of payment (exports less import) deficits. For those wondering if outsourcing is keeping the services part of the trade account negative, a recent Labor Department finding was that it was responsible for 2.5 percent of job losses in the US 4,633 jobs in Q1 2004 out of 182,456. Yes, there may be a bounce in the US Dollar, as the great Yankee Carry Trade of 2003, a/k/a the reflation-trade, fades into Wall Street history. The reality, however, of our deficits could weigh down things again for the greenback, like it or not. The most recent monthly trade deficit figure showed a spike upwards from March's $US 46.6B to $US 48.3B. In the meantime, before we resume the long-term decline of the US dollar, there is the complete unwinding of the Yankee carry trade, which can mean exits of everything traders have been long (commodities, and everything else but the US dollar). This unwinding can mean buybacks of US dollars - accompanied by momentum buying of dollar rises, and speculative refugees fleeing for the harbors of a temporary "safe haven" as they see and try to retreat from the declines in all the formerly favorite assets they were long in during 2003. Still, the deficits remain and grow.


Alternate news accounts indicate heightened yen long speculation - attributed to Nikkei leading the recovery, to optimism regarding Japanese "growth" and export-triggered recovery, including the still odd-looking JGB exposure, which would be vulnerable to yields climbing up and over deflation's wall. With the Japanese CPI in the "zero" region after continual decline since mid 1997, the economy may have reached the no-man's land between negative growth (and shrinking) and positive growth (and inflation). Revised Q1 '04 GDP, bumped up from 1.4% to 1.5%, sounds good as an annualized rate of 6.1% (but we read that nestled within the data are higher inventories and lower capital expenditures, so progress is one step at a time).
We started wondering about higher Yen when the Bank of Japan stopped its currency intervention program. Now we wonder if those shorting JGBs may have to wait as the economy ventures decisively outside of the noman's land of zero growth and firmly into inflation territory. Perhaps this explains, partly and very inadequately, why foreigners seem to be parking funds in the 10-year bond as potential exposure to the Yen. Maybe the Yen can gallop faster than inflation - quickly enough to rate profits for traders to catch and repatriate. Or perhaps there is increasing resort to floating rate JGB alternatives, like the Lehman Floating Rate JGB index, but the 15-year bonds, which make up Lehman's index, and were issued by the Ministry of Finance, amount to less than $2T Yen or about $US 175B. (Our illogical notions, about this activity, are part of our regular quest, to lead and then leave our readers in doubt, but hopefully be sometimes right.)
Reports of Japanese housing prices softening despite the rebound in the economy, with news of a 'housing starts' decline in April 2004 after 5 months of increases, may be cause for concern about the chances for a sustained recovery. Another concern is the continual drop in urban land prices (8.4% percent in the last 12 months ending March 2004). Let us remember however, that Japanese property prices, by our reading, forged ahead briefly for about two years after the Nikkei bubble burst, while the home construction business was still strong for another five to six years after the Nikkei burst. Perhaps the recovery, for the more less-liquid asset class of property, will lag the market, just as it did its decline.
An odd bit of negative news: the markets dipped slightly after word of a leak of irradiated water form a waste disposal facility at a Central Japan nuclear plant. The market went back up again, and hopefully the leak was plugged.
Perturbed by Japan's continual property price dips, and turning to home, literally, we note a report tucked away in the website of The Office of Federal Housing Enterprise Oversight (OFHEO), which gives us pause. We read the research paper, which was not an official release, but an academic study, filled with caveats of its own, that was "circulated to stimulate discussion." We circulate our reaction to this paper in the same spirit. Think about our comments, consider reading the paper and start discussing the matter amongst yourselves please. The December 2003 report is entitled "Drawing Inferences About Housing Supply Elasticity From Home Price Responses to Income Shocks" (OFHEO Working Papers, Working Paper 03-2 by Michelle Hunter-Dreiman). Again, this paper does not represent the official views of OFHEO but its purpose seems relevant for us. We use it to broach our concerns. The study's goal was to "provide information about this price elasticity of the supply of housing" - dry but full of portent for homebuyers, brokers and investment pros. Of course, the report noted that a "broad consensus about the supply elasticity of housing does not exist" and this report is another contribution to the discussion about the housing market. The model used also contained another caveat, that its model was based in part on "an admittedly simple specification of the complete dynamic housing market model. Housing demand, for example, is also impacted by the changes in the user cost of capital, production, population movement and the relative cost of renting" due to an attempt to create a robust model for study - as a model with too many variables resulted in "convoluted outcomes".
In sum, the model allows for rudimentary examination of the long-run response of the price level of housing to a shock to buyers' incomes. The model's price data comes from the HPI, a housing index, where housing prices were based upon transactions from a database derived from Fannie Mae and Freddie Mac loan level data ( a large sample given that 40-45 % of new loans came from these 2 GSEs). The data for personal income is based upon the Bureau of Economic Analysis.
A recovery from income shocks to housing prices indicated that "adjustments to equilibrium take many years; 70 percent of the adjustment occurs with the first 5 years and 90 percent within 10 years." The study estimates seem lengthy but it was pointed out that other studies arrived at longer periods for recovery in prices. "The results suggest that housing prices would be affected by a major shock to demand." An example of a major shock was a theoretical reduction in a hypothetical tax reform plan to a theoretical subsidy for owner-occupied housing, assuming other variables being equal. We pause and wonder about the impact of other theoretical impacts to income on owner-occupied housing. The model is not perfect, it is not official but the market's rules still come out.
And while prices may recover, will the benefit of that recovery come in time for the same homebuyer who came in recently, just before the end of the Fed's most recent "1%" era? The last such era was in 1958 - as for when another such era returns, we do not know. In addition to our earlier account of Japanese property price declines, we also note that the Reserve Bank of Australia raised rates twice quickly by the end of 2003 and that home prices in the major markets there have dropped. (Raising news items like this, smacks of humans' ability to be information "deletion" beings engaging in data mining to create arguments. We're no different, but in our weak defense, we note that this dip in housing prices did happen.)
U.S. homebuilding shares, as we've pointed out last time, were still trading at top-end multiples of book value and as "cheap" as the P/E multiples were, they reflect extremely good times. We fear that the "roof" may cave in eventually. We resubmit a few charts, but there are many more charts that show similar prospects. We simply chose a few of the bigger ones just to remind readers that the entire group is exposed to the same future of higher interest rates. Our suggestion, as in other trades, is to consider exiting, reducing exposure to, or trading a basket of such shares anticipating a correction towards lower book-value multiples, when more "expensive" P/Es indicate bad times.

Lennar (LEN)

DR Horton (DHI)

Pulte Corporation (PHM)
We present below a chart reflecting the Mortgage Bankers Association (MBA) Index, which we've update reflect new weekly data, and apologize to those readers who find it redundant. As you can see, things have only gotten worse, not better, and this is before any "measured" actions were taken.

U.S. home prices continue to climb, but at a slower rate in the first quarter of 2004, after a mad-dash by buyers trying to jump in and own a piece of the American dream before 2003 ended, posting an upwardly revised 8.13% year over year increase above Q1'03. Home price appreciation, annualized, for Q1 2004 slowed from a rate of 14.85% (Q4'03) and the Q1'04 annualized income was the smallest since 3.23% of Q2'98. On a sequential basis, home prices on average rose 0.96% (between Q4'03 to Q1'04), the smallest rise since 0.81% for Q2'98. Please note the following details out of the Office of Federal Housing Enterprise Oversight (OFHEO) - which some of our readers may have expected. The following chart of the Home Price Index (HPI) reflects the emergence of changes that cannot be ignored.
OFHEO House PriceIndex History for USA 1990Q1 to 2004Q1
Source: OFHEO
Indeed, the end of the "1%"era has arrived, just by looking at market prices. Yields are up, and we see official releases relating to recovery, and we see accounts of inflation. Prices for houses are up, but so it is for food and fuel. This is a trend we are mindful of. Whether interest rates are hiked gradually or more than just gradually, or it's inflation (e.g. the eventual "tax" of higher oil prices follows the initial inflationary shock), incomes and the ability to buy a basket of goods and services will be hit. If we think back to the heavily conditioned, yet logical paper we mentioned from OFHEO, the HPI index we've included, this reflects a precarious development for homebuilders. We end this particular discussion, having repeated ourselves.
So, if interest rates are only going up, what then for our reflation watch? We note that prices in shares we've been watching since February have revived from their decline, but we believer that this is temporary and that profit taking, and now loss-taking, fires are igniting in investment portfolios everywhere. Ultimately one of the top beneficiaries of reflation, the bond bull market, and of also the housing boom are securities firms. They originate, resell, trade, and buy back, have been paid handsomely and it looks like their valuations reflect this. We broached the idea in the last few notes and we are pleased to present the observations of UK research firm Smithers & Company. (We thank the firm for their kindness in granting us access and for the privilege to reflect on their observations.) Their report, "Are US Financial Companies Even More Overvalued Than The Market?" June 2, 2004, Report No. 218) asks a question about a significant part of the US economy. In a nutshell, the answer to the title is "yes".
The broad strokes are that the profit margins of financial companies are "exceptionally high and vulnerable", that " the favorable condition of falling bond yields and a steeper yield curve, which helped drive up margins, are likely to have ended", and lastly, "it is likely that financial companies are even more overvalued than [all] shares [financial and non-financial] generally."
We had been fretting over these shares for months and we noted our intent in previous notes about addressing them. We take the liberty of outlining the cogent argument from the Smithers firm. To begin, 37% of all US domestic profits came from financial companies, versus 7% of profits for all domestic profits in 1948, and recent margins for financial companies are 26% higher than the historic average. (Non-financials profit margins were only 3% above their historic average). One theory in the report suggests that these high margins may be linked to bond yields, which fell from 1980 to 2003 - the period of the great bond bull market we alluded to earlier in this note. The report characterizes one of the sources of profit for financials, as derived by "maturity transformation" (a phrase we would like to adopt and use from time to time in the future as long as the Smithers firm does not object) courtesy of the bond bull market.
While the valuation of the beneficiaries carry relatively low P/E ratios, the report questioned whether they were adequately discounted for the poor future prospects of a rising interest rate world. The Smithers' firm approach to a top town valuation of the markets in total included a "cyclically adjusted P/E" and the "Q" ratio. Its finding for the P/E ratio indicated an 80% overvaluation in the market. The Q ratio - applicable for non-financial valuation, indicated a 58% overvaluation. If the firm is correct, then financials are both relatively and absolutely overvalued. (We pause and note our alarm has only been reaffirmed. We now resume our discussion.)
The Q ratio, for those who are curious, is defined as relating to the replacement value of net assets. Drawing from another Smithers' helpful release, available on their website, "Stock Market Valuations", we note that Q is based on the framework that stocks, as title to real assets, ideally have a market value equal to the cost of their production. Q equals the ratio of the market value of companies to the replacement cost of their assets. The market value of companies can be obtained readily and the replacement costs, while not as evident, are derived from official source data in the aggregate form, from sources like Federal Reserve data. (For us and many other readers, this forms a rational, fundamental analytical perspective. Expert-based analysts among our readers would be drawn and are likely using a similar approach. Our trend-trading readers may ignore us.)
Where do the financial companies profits come? They charge fees for the assumption of credit risk (loaning money is a credit risk), and note that if credit spreads narrow and defaults were to be static or even rise, then profits shrink. (We observe a recent report from the ratings firms that defaults for speculative grade US and European credits appear to be in decline. But there is a caution out of S&P that defaults could return in 2005, given elevated issuance of lower grade, S&P 'B-' or lower credits, although some of the dealing may have related to balance sheet restructuring and strengthening.) Another profit center includes the aforementioned " maturity transformation", from borrowing, buying bonds - generally profitable as long as investments are of a longer duration and carry higher interest rates and returns than the money owed (liabilities). If the interest rate environment turns bearish for bonds, and rates rise, then the power of maturity transformation can work against these companies and profits in general shrink. The power drawn against balance sheets made for good trading when the yield curve was steep.
The Smithers report notes also that there is a "natural balance" of alternating cycles at making profits from credit risk and maturity transformation. As economies weaken so can credit, while interest rates sink, boosting maturity transformation-based profits. Vice versa. We are worried about the "vice versa", as reports come out, crying out recovery, and prodding the "gradual" return of higher interest rates, putting to rest maturity transformation profits.
Lastly, there are profits also from trading and dealing in the markets, such as the bounty of rising bond markets, accompanied by mortgage and bond refis. As we noted earlier, refi activity has declined sharply and we are early to this development. In short, the engine for financial company profits, appears to be in reverse, as interest rates begin to rise, and the overvaluation, as explained by the Smithers report, is indeed "vulnerable".
What is to become for those accustomed to making markets when bid-ask spreads tighten further under competitive pressure? What will happen when various other fees for other forms of financial intermediation come under pressure, while the outlook for internal trading profits (e.g. reflation trade's end) diminishes? Here, we depart from the Smithers report and we take the liberty to include the charts of a few financial companies. We concern ourselves initially with publicly traded securities brokerages known for their "man on the street" retail business. Despite the robust activity in the markets over the past year, we see that the shares of some companies presiding over the mini-boom of the past year have themselves fared poorly in recent weeks. What will happen, if as we expect, when low interest rates comes stop being low? Securities brokerage shares could continue their decline. Other financial company charts may follow in subsequent note, we merely a present a basket of securities brokers to consider. Truly, we are not trying to pick on any individual issue - for they might indeed be all "vulnerable", and we say less and less justifiable to hold indefinitely.
Please expect us to discuss this matter in future notes as we leave you with a few charts to look at. For the next market note we also hope to ponder the relationship between equity earnings and bond yields, continue our reflation wind-down watch, and update our observations and concerns from recent market notes.
Charts of a few securities brokers, there are many, here a few to start our discussion for next issue:

Charles Schwab (SCH): the discounting continues

E-Trade (ET): Time to EX-ET?

AG Edwards (AGE): Feeling its AGE?

Ameritrade (AMTD): Ameri-trouble?
This report's evolving market perspective is based upon a perceived structure to speculative activities - which we characterize as falling within four groups: trend, contrarian, arbitrage and expert-based. Trends are profitable for the momentum and trend player. At some point Contrarians have their moment in the sun and those who are "lucky" enough to come in, or have somehow timed their speculations successfully, make their money by fading the aging trend. About the same time sometimes an "arbitrage" is detected, based upon an assertion of an over-, or under-, valuation, or prices under, or above, historical mean prices and multiples, or an evaluation of an anticipated regulatory or corporate event, while "experts" and knowledge specialists, who waited for some confirmation, in quarterly, periodic or fundamental indicators begin to evaluate, publicize their opinions and findings, confirming the emergence of what evolves into a new trend. This new trend then picks up steam. It could emerge into a cyclical high or low, or a manic period, to be followed by a counter-cycle and/or reaction enjoyed by the next contrarians, and so on and so on. We are often in doubt, but sometimes right. We disclose this evolving bias to our readers as a caveat.


