• 962 days Will The ECB Continue To Hike Rates?
  • 962 days Forbes: Aramco Remains Largest Company In The Middle East
  • 964 days Caltech Scientists Succesfully Beam Back Solar Power From Space
  • 1,364 days Could Crypto Overtake Traditional Investment?
  • 1,369 days Americans Still Quitting Jobs At Record Pace
  • 1,371 days FinTech Startups Tapping VC Money for ‘Immigrant Banking’
  • 1,374 days Is The Dollar Too Strong?
  • 1,374 days Big Tech Disappoints Investors on Earnings Calls
  • 1,375 days Fear And Celebration On Twitter as Musk Takes The Reins
  • 1,377 days China Is Quietly Trying To Distance Itself From Russia
  • 1,377 days Tech and Internet Giants’ Earnings In Focus After Netflix’s Stinker
  • 1,381 days Crypto Investors Won Big In 2021
  • 1,381 days The ‘Metaverse’ Economy Could be Worth $13 Trillion By 2030
  • 1,382 days Food Prices Are Skyrocketing As Putin’s War Persists
  • 1,384 days Pentagon Resignations Illustrate Our ‘Commercial’ Defense Dilemma
  • 1,385 days US Banks Shrug off Nearly $15 Billion In Russian Write-Offs
  • 1,388 days Cannabis Stocks in Holding Pattern Despite Positive Momentum
  • 1,389 days Is Musk A Bastion Of Free Speech Or Will His Absolutist Stance Backfire?
  • 1,389 days Two ETFs That Could Hedge Against Extreme Market Volatility
  • 1,391 days Are NFTs About To Take Over Gaming?
  1. Home
  2. Markets
  3. Other

Market 'Up Thrusts' vs. Declining Volume Readings

What makes for a good market technician?

Three things:
1. Good data that the general public doesn't have.
2. Great analytical models that clearly express what "is really happening" in the markets.
3. Experience and good judgment.

Most investors lack #1 and #2. Take a look at today's model and data for instance.

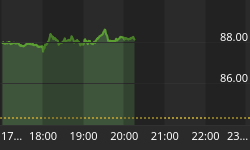
Today's chart shows something as simple as the New York Stock Exchange's Declining Volume. This chart goes back to July 2009. Out of the past 8 market up thrusts during that time, this model has identified all 8.

Note when the model shows that the inverted declining volume moved up over the horizontal line. In each case, the market also began a new up move.

The last one was the beginning of April ... but, before feeling too bullish, take a look at where the indicator is now. It is during such times that pull backs occur and it during these times that investors should take cautionary stances or actions.

Not a paid subscriber yet? If you feel that our data and models may help your investing efforts, why not at least give StockTiming's service a try? Have a great weekend, and we will see you on Monday.

NYSE Declining Volume


Back to homepage

Leave a comment

Leave a comment