


Summary of Index Daily Closings for Week Ending June 25, 2004
| Date | DJIA | Transports | S&P | NASDAQ | Jun 30 Yr Treas Bonds |
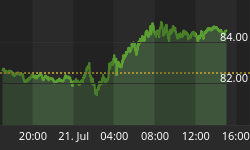
| June 21 | 10371.44 | 3066.24 | 1130.32 | 1974.38 | 105^09 |
| June 22 | 10395.07 | 3077.83 | 1134.41 | 1994.15 | 105^03 |
| June 23 | 10479.67 | 3139.37 | 1144.04 | 2020.90 | 105^08 |
| June 24 | 10443.81 | 3127.26 | 1140.62 | 2015.57 | 105^31 |
| June 25 | 10371.84 | 3164.18 | 1134.32 | 2025.47 | 105^31 |
| SHORT TERM FORECAST (Next Two Weeks) | ||||
| TREND | PROBABILITY | Legend | ||
| Substantial Rise | Low | |||
| Market Rise | Medium | Very High | 80% | |
| Sideways | Medium | High | 60% | |
| Market Decline | High | Medium | 40% | |
| Substantial Decline | Medium | Low | 20% | |
| Very Low Under | 20% | |||
| INTERMEDIATE TERM FORECAST (Next 12 Weeks) | ||||
| TREND | PROBABILITY | Substantial | 800 points+ (DJIA) | |
| Substantial Rise | Low | Market Move | 200 to 800 points (DJIA) | |
| Market Rise | Medium | Sideways | Up or Down 200 (DJIA) | |
| Sideways | Medium | |||
| Market Decline | High | |||
| Substantial Decline | High | |||
This week the Dow Jones Industrial Average closed down 44.57 for the week at 10,371.84. This price action diverged with the NASDAQ Composite - up 39.24 (nearly 2%), and the Transports - up a whopping 95.51 (up 3.1% for the week). The S&P was down only a hair. Divergences in Major Indices are a sign that something is wrong. We believe that message is Bearish.
The DJIA's decline Friday was on increasing volume, the Relative Strength Indicator is neutral, and prices sit in the middle of their 2 percent Bollinger Bands. The Moving Average Convergence/ Divergence looks like it wants to move lower. Still, over the near-term there are Master Planner incentives to see the DJIA and S&P move higher as quarter-end approaches, so we cannot rule out more short-term rally - absent some sort of international crisis - through July 4th. On balance we feel the odds of DJIA prices moving down are slightly more than moving up over the short-term.
The inflation gauges are up this week, the CRB Index, Gold, and Silver. This stands to reason with all the money being injected into the system.
| Equities Markets Technical Indicator Index (TII) ™ | ||||
| Week Ended | Short Term Index | Intermediate Term Index | ||
| Feb 20, 2004 | (30.00) | (22.36) | Scale | |
| Feb 27, 2004 | (31.00) | (20.17) | ||
| Mar 5, 2004 | 16.00 | (17.17) | (100) to +100 | |
| Mar 12, 2004 | ( 9.00) | (14.70) | ||
| Mar 19, 2004 | (12.00) | (27.60) | (Negative) Bearish | |
| Mar 26, 2004 | 73.00 | (38.35) | Positive Bullish | |
| Apr 2, 2004 | (3.00) | (35.61) | ||
| Apr 16, 2004 | (43.00) | (29.90) | ||
| Apr 23, 2004 | 94.00 | (22.69) | ||
| Apr 30, 2004 | (33.25) | (34.88) | ||
| May 7, 2004 | (28.75) | (47.75) | ||
| May 14, 2004 | (25.75) | (66.45) | ||
| May 21, 2004 | 22.00 | (67.23) | ||
| May 28, 2004 | ( 3.50) | (48.48) | ||
| June 4, 2004 | (55.75) | (34.07) | ||
| June 11, 2004 | (77.75) | (25.92) | ||
| June 18, 2004 | (40.25) | (31.17) | ||
| June 25, 2004 | (34.00) | (26.10) | ||
This week the Short-term Technical Indicator Index comes in at negative (34.00), indicating a market decline is probable. This indicator is a useful predictor of equity market moves over the next two weeks, both as to direction and to a lesser extent strength of move. For example, readings near zero indicate narrow sideways moves are probable. Readings closer to +/-100 indicate with a higher degree of confidence that an impulsive move up or down is likely over the short run. Market conditions can change on a dime, or the Plunge Protection Team can come in and temporarily stop market slides, so it may be unwise to trade off this weekly measured indicator. While markets could rise next week a bit more, the Short-term TII, with a time horizon of two weeks, continues to see trouble.
The Intermediate-term Technical Indicator Index is useful for monitoring what's over the horizon - over the next twelve weeks. It serves as an early warning system for unforeseen trend changes of considerable magnitude. This week the Intermediate-term TII comes in at negative (26.10), indicating that a decline is probable. Massive infusions of M-3 are respected by this indicator, and have reduced the severity of this reading.
The Upside Dow Theory non-confirmation just got worse as the Trannies screamed to a new closing high for the rally since March 2003, ending the week at 3,164.18. This means that the hurdle the Industrials have to leap to confirm the Bullish case just rose from 10,570 to 10,737, its closing high for this rally since March 2003. With the DJIA ending the week at 10,371.84, that leaves the Industrials 366 points shy of confirmation. For now, we do not have a Dow Theory Buy signal.
Last week we showed charts of Russia, China's Shanghai, and India's equity markets crashing. The charts on the next page (courtesy of www.stockcharts.com) show two more stock crashes occurring, Hong Kong's and South Korea's.


While the past is no guarantee of the future, in looking back at Dow Transport/Industrial divergences over the past five years, every single time we had one, a stock market crash occurred shortly thereafter - within two to three months.
We saw both downside and upside divergences in late 2000 into early 2001 which led to a crash in March 2001 (1,469 points, 13.5% in ten trading days). We are seeing another double divergence now. The late 1999 divergence led to the early 2000 crash in both indices. The early 2001 divergence led to the August/September 2001 crash (2,187 points, 20.9% over 15 trading days). The late 2002 divergence led to the early 2003 mini-crash (1,318 points, 14.9% in the DJIA). Crashes have occurred during this four year Bear Market without prior Tranny/Industrial divergences, but divergences have not occurred without subsequent crashes during this time frame.
The Trannies finished the week through the roof and it begs the question, why are the Transports one of the few indices stampeding at this time? What is unique to them that would attract buying, almost exclusively? Just a hypothesis, but what if consumers and businesses are doing more internet and catalogue buying than in the past due to rising gasoline prices and the need for fuel efficiencies? That would mean Fed Ex and Big Brown would see rising revenues, yet overall sales in the economy wouldn't necessarily be rising proportionately - less shoe leather and more let-your-fingers-do-thewalking? It would explain why contemporaneous to the Tranny rally, the Retailers' stocks aren't doing so well, and why Wal-Mart is faltering. Just a thought.


The above chart comparing the highly correlated S&P 500 with the SPX/VIX is telling us that absolutely we are not entering into a period of a long-term rally. Should averages head higher from here and follow the Trannies, they are merely reaching new tops from which the dramatic decline we've been expecting will emerge. This chart is telling us the recent rally is another set up, similar to the top in 2000. Perhaps we'll see the S&P rise from here, perhaps to a level where this ratio rises to 90, but that wouldn't take much and would signal an intermediate-term slide. We would get an SPX/VIX ratio of 90 should the S&P rise a mere 25 points to 1160 and the VIX fall a bit from present levels to around 13. Not out of the realm of possibility given quarter-end window dressing and the July 4th holiday euphoria coming up over the next two weeks. Should the Fed raise interest rates a mere 25 basis points, or surprise everyone by holding off completely, that would likely fuel short-term buying driving this ratio to a severe overbought peak level. But a crash can occur from current SPX/VIX ratio levels, and at any level over 68.
The Economy:
According to the National Association of Realtors, Sales of Existing Homes rose 2.6 percent in May. The Commerce Department reported that New Home Sales were also up an astounding 15 percent in May over April. With thirty-year mortgage rates on the rise, around 6.25 percent, these figures on the surface are impressive. However, more than likely it represents panic buying from folks on the fence, forced into making the decision to buy now for fear interest rates will rise further. In other words, in all likelihood, future sales have been pushed up into the present.
Durable Goods Orders fell significantly for the second month in a row, down 1.6 percent in May after a revised 2.6 percent plummet in April according to the Commerce Department. These were the first consecutive monthly drops since late 2002. This number should give the Fed the latitude it undoubtedly seeks to either postpone or keep to a minimum an interest rate hike next week.
Gross Domestic Product was revised lower to 3.9 percent from 4.4 percent for the first quarter 2004 according to the Commerce Department. This also helps the Fed justify a "pass" next week should they choose to do so since this shows declining growth from the fourth quarter 2003 to the first quarter 2004.
Jobless Claims are on the rise again, up to an unsatisfactory 349,000 for the week ended June 19th, 2004. The e-mails I have been receiving of late verify that jobs remain a continuing problem in most parts of the country, contrary to the estimate-heavy non-farm payroll figures the Labor Department has been reporting the past 3 months.
The University of Michigan's Consumer Sentiment Index final June reading came in up, to 95.6 from 90.2 in May, a short-term Bullish indicator for stocks. However, since it is now late June, the predictive value of this figure may not be significant for any period past the first week of July.
Money Supply, the Dollar & Gold:
Crisis liquidity infusions continue. M-3 rose 38.9 billion for the latest week reported, June 14th, on a seasonally adjusted basis, and 33.3 billion on a non-adjusted basis. Both numbers are huge for one week, the seasonal figure annualizing to over $2.0 trillion, a 22% annual increase. Over the past 8 weeks, M-3 is up $179.8 billion, a $1.17 trillion, 13 percent annualized rate of growth. Clearly the Fed is keeping the liquidity spigot on full throttle, as concerns remain over equity market spillage from Asian collapses, the impact of interest rate increases on the debt bubble, and the systemic risks from the highly leveraged, low-interest-rate-dependent balance sheets of Fannie and Freddie. Plus of course Dubya has to get reelected.
We also cannot rule out that the Fed is eyeing a systemic risk we do not yet know about. There is just too much M-3 pouring in week after week for "normal" times.
The HUI's Crash appears to be finishing off a corrective symmetrical triangle, wave 4 up of a five-wave down sequence that should lead prices toward - perhaps below - 150 over the next month or two. Corrective symmetrical triangles are common in Elliott Wave 4's, and the pattern implies that the directional move that preceded the triangle should continue after completion at the converging boundary trend lines.
Gold the metal remains inside its long-term rising trend channel, however a Bearish Double Top and the corrective nature of the current rally appears to indicate an Elliott Wave five-wave down sequence is underway, with impulsive wave 1 down complete, and corrective wave a-b-c 2 about over.


Gold has corrected 50% of wave 1 down's move and could go as high as 410, which would be a Fibonacci 61.8% retrace of wave 1. If wave 2 stops around 410 or below, wave 3 down should be next, drawing Gold toward 350. Even if Gold declines below its upward trend channel, given the massive growth in fiat currency which is expanding at a pace far faster than GDP, Gold should eventually rise. Once one major nation chooses to back its currency with the metal, Gold should catapult. That may be more than a few years away. For now it is accumulation time with dips providing good buying opportunities for the long haul.
The Dollar looks toppy, with a possible Bearish Head & Shoulders completing. A decline below 87 will confirm the pattern with a minimum downside target of 82. A Rounded Bearish Top pattern is rolling over, and the MACD looks like it is ready to break down. This makes perfect sense given the hyperinflationary M-3 creation by the Federal Reserve. It is ridiculous for the Fed to allow M-3 to rise at a double digit annualized rate of growth given a supposed strong recovery and its intent to raise short-term interest rates. Something doesn't wash here and the Dollar is the canary in the mineshaft.


Bonds and Interest Rates:
The U.S. 30 Year Treasury Bond is starting its long journey south from the right shoulder of an ominous Bearish Head & Shoulders pattern (not shown here - see issue number 57 in the archives of www.technicalindicatorindex.com) with an Elliott Wave five-wave down sequence that has seen wave 1 down and is now finishing up a corrective a-b-c wave 2 up before wave 3 takes prices down hard. Targets for the current wave 2 rally range from 107.17 (a Fibonacci 38.2% retrace) to 110.31 (a Fibonacci 61.8% retrace of wave 1). There is an outside chance for its price to rebound all the way to 112.50, a 78.6 % retrace - that magnitude of a correction would likely occur only if deflationary forces - some sort of crisis - were to appear over the next two months, something that would inspire an equity crash.
Well, Tuesday is the big day, June 29th, Fed Day. Will they or won't they? I do not see a 50 basis point increase at this time. Enough economic numbers are weak to keep a lid at 25 basis points. The debt bubble is not going to tolerate the sort of short-term rate increases the market is expecting, and the Fed knows this. Too much variable rate consumer debt. Rising rates would completely undo the tax breaks, and shut down consumer disposable income. Income is already hard enough to find. With all the M-3 being pumped into the system, I wouldn't at all be surprised if the Fed passed on any increase this month. The safe play is 25 basis points, but the Fed's heart won't be into it.
Bottom Line:
Short-term, the Master Planners and their Wall Street minions covet a rising equity market going into the end-of quarter. They want to be able to point to charts and reports that show equities are up for the quarter and the year. This helps election campaigning and sells stocks. But as of today, the Dow Industrials are down year-to-date 2004. The July 4th holiday is often a seasonal Bullish moment, so equities can run higher for a couple of weeks. Any sharp declines could likely be manipulated to force shorts to cover and fuel a rally. The Master Planners would love to see the DJIA top 10,737 and set up a technical Dow Theory Buy Signal in the hopes of building Bullish sentiment going into the autumn election. That said, there are several key charts that warn equities are at high risk over the next sixty days. We've presented some of them here. M-3 can mitigate the damage of equity slides, and can even delay them. M-3 is growing at levels only seen during past economic crises. Why? Obviously the Fed doesn't like something it sees. Caution is warranted.
"Cursed is the man who trusts in mankind,
And makes flesh his strength,
And whose heart turns away from the Lord.
Blessed is the man who trusts in the Lord,
And whose trust is the Lord."
Jeremiah 17: 5, 7
Please check out Nelson Hultberg's excellent article "Cornered Rats and the PPT" in the Guest Article section at www.technicalindicatorindex.com. In it he explains how the Plunge Protection Team works.
Special Note: Be sure to register under the subscribers' section at www.technicalindicatorindex.com for e-mail notifications of our new mid-week market analysis, usually available on either Tuesdays or Wednesdays. These midweek updates will only be available via e-mail and in the future will not be posted on the web.
| Key Economic Statistics | ||||||||
| Date | VIX | Mar. U.S. $ | Euro | CRB | Gold | Silver | Crude Oil | 1 Week Avg. M-3 |
| 1/23/04 | 14.88 | 88.81 | 125.81 | 266.50 | 408.0 | 6.36 | 34.94 | 8870.6 b |
| 1/30/04 | 16.46 | 87.48 | 124.42 | 262.10 | 402.9 | 6.25 | 33.05 | 8901.7 b |
| 2/06/04 | 16.00 | 86.15 | 126.83 | 260.50 | 403.6 | 6.27 | 32.43 | 8891.6 b |
| 2/13/04 | 15.62 | 85.68 | 127.25 | 264.85 | 410.8 | 6.58 | 34.56 | 8904.2 b |
| 2/20/04 | 16.05 | 87.40 | 126.96 | 264.50 | 397.5 | 6.53 | 34.25 | 8942.7 b |
| 2/27/04 | 14.53 | 87.89 | 124.52 | 273.90 | 396.8 | 6.71 | 36.16 | 8962.4 b |
| 3/05/04 | 14.52 | 88.75 | 123.28 | 274.00 | 401.6 | 6.99 | 37.26 | 8974.1 b |
| 3/12/04 | 18.21 | 89.60 | 121.80 | 272.00 | 395.6 | 7.06 | 36.19 | 8964.0 b |
| 3/19/04 | 19.15 | 88.56 | 122.47 | 280.20 | 412.7 | 7.56 | 37.62 | 9005.8 b |
| 3/26/04 | 17.12 | 89.30 | 120.90 | 278.25 | 422.3 | 7.71 | 35.73 | 9015.3 b |
| 4/02/04 | 15.81 | 88.80 | 121.12 | 280.00 | 421.1 | 8.15 | 34.39 | 9059.6 b |
| 4/08/04 | 16.38 | 89.82 | 120.56 | 284.00 | 419.9 | 8.09 | 37.14 | 9047.1 b |
| 4/16/04 | 15.00 | 90.18 | 119.50 | 276.75 | 401.6 | 7.14 | 37.74 | 9062.6b |
| 4/23/04 | 14.01 | 91.34 | 118.18 | 267.50 | 395.7 | 6.16 | 36.46 | 9068.3 b |
| 4/30/04 | 16.69 | 90.76 | 119.70 | 270.75 | 387.5 | 6.07 | 37.38 | 9115.6 b |
| 5/07/04 | 18.13 | 91.30 | 118.83 | 270.40 | 379.1 | 5.58 | 39.93 | 9172.5 b |
| 5/14/04 | 18.47 | 91.81 | 118.69 | 267.00 | 377.1 | 5.72 | 41.38 | 9174.7 b |
| 5/21/04 | 18.44 | 90.53 | 120.05 | 268.75 | 384.9 | 5.87 | 39.93 | 9220.7 b |
| 5/28/04 | 15.52 | 88.98 | 122.10 | 276.25 | 394.0 | 6.11 | 39.88 | 9194.9 b |
| 6/04/04 | 16.57 | 88.50 | 122.93 | 274.75 | 391.7 | 5.81 | 38.49 | 9199.5 b |
| 6/11/04 | 15.10 | 89.23 | 121.01 | 269.25 | 386.6 | 5.78 | 38.45 | 9208.5 b |
| 6/18/04 | 14.95 | 89.41 | 121.17 | 267.75 | 395.7 | 5.98 | 39.00 | 9247.4 b |
| 6/25/04 | 15.19 | 89.22 | 121.41 | 270.75 | 403.2 | 6.12 | 37.55 | - |
Note: VIX, Dollar, and Euro flat; CRB, Gold, Silver are up. Oil down.


