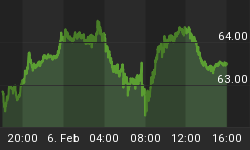
We will kick off with a review of the charts for gold, silver and the gold bugs index, the HUI, in an attempt to see where we are now and just where we might go from here. However, to put the charts into context we need to take into consideration the surrounding political, economic and investment landscape. These are volatile times with the financial markets in turmoil as what were perceived to be sound and secure governments now toil under the strain of their own excesses. The borrow and spend philosophies are coming back like a bad penny, to haunt not just those who caused this mess, but also for the rest of us, who are expected to clear it up. The follies vary from mis-management to corruption, resulting in people taking to the street to protest the latest craze of austerity and belt tightening. Society, in general, has high expectations in terms of their standard of living and the mere thought of it heading lower is not acceptable to them. Take state pensions, for example, millions of people are expecting it to be there for them when they retire, however, the pensions cupboard is empty and therefore the concept of sitting back as the cheques roll in is well and truly dead in the water. We need to start protecting ourselves now, don't wait, make it the number one priority to put your independence at the top of your 'To Do' list.
Taking a quick look at the above gold chart we can see that the sell off in gold prices of $60.00/oz has now steadied and gold appears to be set to continue its rally. Note both the 50 day and the 200 day moving averages are climbing gently in support. The RSI has turned north and the STO has just made a crossover, which is usually a positive sign.
Next we have the HUI which is making steady progress despite the volatility and is now perched just above the 200dma. Looking at the technical indicators we can see the RSI has turned north just above the '30' level and that the STO has also turned up having dipped below '20', again all positive for the gold and silver mining producers.

Turning to silver we can see that the pull back looks to have run its course so we are looking for silver prices to head to higher ground. The technical indicators are now out of the overbought zone thus reducing the selling pressure on silver and allowing it the space to resume its advance.

In conclusion we are of the opinion that the precious metals should once again be bought, gold, silver and their associated stocks. As a word of warning though, its still not clear to us whether or not the stocks will go down in the face of a broader market sell off should it occur. So go gently and make your acquisitions on a 'layered' basis. Finally, we are considering the purchase of a number of options trades which should be profitable during the next move up, which we believe to be imminent.
To ensure that you optimize your investing and trading returns from the next move, please take a look at our website www.skoptionstrading.com. Recently our premium options trading service OPTIONTRADER has been putting in a great performance, with an average gain of 42.73% per trade, in an average of just under 38 days per trade.
Got a comment then please add it to this article, all opinions are welcome and appreciated.
To stay updated on our market commentary, which gold stocks we are buying and why, please subscribe to The Gold Prices Newsletter, completely FREE of charge. Simply click here and enter your email address.


