• 1,100 days Will The ECB Continue To Hike Rates?
  • 1,100 days Forbes: Aramco Remains Largest Company In The Middle East
  • 1,102 days Caltech Scientists Succesfully Beam Back Solar Power From Space
  • 1,501 days Could Crypto Overtake Traditional Investment?
  • 1,506 days Americans Still Quitting Jobs At Record Pace
  • 1,508 days FinTech Startups Tapping VC Money for ‘Immigrant Banking’
  • 1,511 days Is The Dollar Too Strong?
  • 1,511 days Big Tech Disappoints Investors on Earnings Calls
  • 1,512 days Fear And Celebration On Twitter as Musk Takes The Reins
  • 1,514 days China Is Quietly Trying To Distance Itself From Russia
  • 1,514 days Tech and Internet Giants’ Earnings In Focus After Netflix’s Stinker
  • 1,518 days Crypto Investors Won Big In 2021
  • 1,518 days The ‘Metaverse’ Economy Could be Worth $13 Trillion By 2030
  • 1,519 days Food Prices Are Skyrocketing As Putin’s War Persists
  • 1,522 days Pentagon Resignations Illustrate Our ‘Commercial’ Defense Dilemma
  • 1,522 days US Banks Shrug off Nearly $15 Billion In Russian Write-Offs
  • 1,525 days Cannabis Stocks in Holding Pattern Despite Positive Momentum
  • 1,526 days Is Musk A Bastion Of Free Speech Or Will His Absolutist Stance Backfire?
  • 1,526 days Two ETFs That Could Hedge Against Extreme Market Volatility
  • 1,528 days Are NFTs About To Take Over Gaming?
  1. Home
  2. Markets
  3. Other

Charts Window on Key Asset Categories

US government and credit bonds are in a continuing uptrend over three years, whether short, intermediate or long maturity. Since April, when stocks began having trouble, the bond uptrend became steeper. In the past few days as some relief is being felt over the European crisis (far from good, just temporarily not perceived as so bad), US bonds have backed off a bit, but have not pierced a support line connecting recent bottoms. Long maturity bonds, expectedly, had the greatest upward and downward movement ...

The US market spent 5 days below the 200-day average, and rose above today, but has retraced only about 1/3 of the distance from its recent low to its April high ...
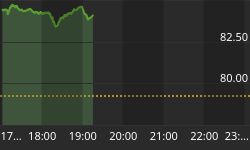
Charts Window on Key Asset Categories


Read the Report

Back to homepage

Leave a comment

Leave a comment