Stocks went down sharply today on concerns over consumer confidence and indications that show that the economy is stalling in China. China has been a leading market in this recovery and its bull market has helped the price of industrial metals and base metals.
Over the past few weeks I have highlighted that the market has given signs of a major deflationary crisis and economic slowdown. Today these signs became apparent with a significant sell off on high volume and a break into new lows for the S&P 500 and Nasdaq.
Today major institutions sold equities and sought shelter in treasuries and the dollar. Gold and silver both sold off early in the day but gold fought back and closed up and silver was able to recoup some of its losses. Gold and silver are still in a uptrend and above both the 50 day and 200 day moving average. Gold and silver miners also appear to be close to a major breakout.
The S&P 500 and Nasdaq had a significant break of previous lows on high volume. I alerted readers several days ago to buy inverse etf's when the markets failed to regain the 50 day moving average for the second time. Many times after this second failure the market has a major breakdown. The time to short is when the averages fail at the 50 day, not when it makes new lows as many less experienced traders are doing now.
Many traders are fearing that silver and gold may be a top here as they are comparing 2010 to 2008. I understand that fear and am monitoring that situation closely. I have received a lot of requests to comment on the situation.
At the moment I believe that we will not see a correction in precious metals like we saw in 2008. There has been a global concerted effort for governments to devalue currency and assist the economy with unprecedented spending and cheap dollars. The Euro is on the verge of a collapse and there are major sovereign debt issues that are spreading to more countries. I do not believe the U.S. government will be immune from those debt issues. The United States has high unemployment, weak consumer confidence, a huge amount of debt and poor GDP growth.
Gold miners appear to be on the verge of a major breakout into new pre credit crisis highs.

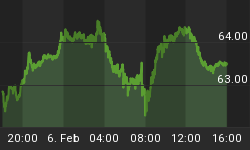
The chart above shows the relative strength of the gold miner etf to the S&P 500. A break to 51 on that chart would show great relative strength to the market. During this market downturn since May 6th, miners and bullion have shown good relative strength which does not make me conclude that we are having a repeat of 2008.
Disclosure: Long Gold and Silver Mining Stocks


