


July 13, 2010
- My subscribers are probably the largest group of GDXJ shareholders. If I told everyone last week that "it's gonna crash, it's 2008, sell everything!" I probably could have tanked the GDXJ down to the $15 area, maybe even to $10. Of course, I didn't say that. I said buy.
- I termed July 1st 2010 "Black Thursday". Tuesday, July 6th was another black day. Those two days were marked by massive selling across the board, in both the gold and fund communities. I was inundated with various email "analysis" showing me why gold was going down and how wrong I was to buy as it fell. Question: How important does that analysis seem this morning, how wrong am I now?
- This situation reminds me greatly of past bottoms in the market. Putting in a final low is a process, not an event. The level of negativity last week was extreme. The COT report released on Friday July 9th did not cover the comex gold market trading for July 7th. The report ended July 6th, and July 7th was the 1185 low.
- As it was, the "banksters" (commercials group in the cot report) booked profit on about 35,000 gold contract shorts, and went long another 10,000, while the funds and gold community bailed on about 37,000 longs, an act of madness, and added about 10,000 shorts into the lows. Again, the gold-bailing and shorting actions of the gold and fund community into that sell-off must be defined as: Madness.
- We'll never know exactly what transpired on July 7th, because the COT reports are a weekly report, not a daily report. Regardless, I'm only 99.9999% sure that the banksters bought even more longs into 1185, as I did, and covered even more shorts, while the gold and fund communities booked more losses and added huge fresh short positions at the exact bottom.
- I made a "herculean" effort to keep my people on the gold buy, and I urged everyone in the gold community to do the same. Money flows talk; the reality of what was done can't be talked away. Broken parabola dreams were front and centre in the gold items bonfire. The selling of gold ends when those doing it stop, and not before.
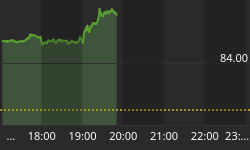
- A picture speaks a thousand words. The story of gold in the short term is the story on this chart. Gold July 13
- This is a chart covering the past 2 weeks of gold trading action, and there is a head and shoulders bottom with a double head. You want to be a seller of gold if it rises thru 1215, and a buyer if the pattern implodes and 1185 is taken out. Everything else is meaningless. Throw all analysis in the garbage as price either rises above 1215 or falls under 1185, and simply act professionally with your buy and sell orders.
- Don't predict or chase price. Respond. It's not a question of IF price moves above 1215 or below 1185, it's a question of when, and time is drawing closer. As price moves past either 1215 or 1185, you equally quickly throw all that analysis in the garbage can, and take professional gold soldier action in the market, either buying weakness or selling strength, without exception.
- This is 2010. Not 2008. Not 1929. 2010 is about the success or failure of QE, quantitative easing. I believe the year ends with the failure of QE, and by definition Dr. Ben Bernanke then opens his toolbox and pulls out his gold revaluation tool.
- The question you need to ask yourself is whether you think ramped up QE can solve a major currency crisis, a crisis that could involve multiple major currencies. What assets, specifically, will be bought to pump liquidity into the system, and to what end? Does buying some more Fannie Mae stock solve such a currency crisis? Maybe the Enron and Nortel caskets can be opened up, and "QE Enron/Nortel" solves a global currency crisis, or maybe not.
- Let me elaborate further: Banks don't want to lend money, and solid businesses don't want to borrow anything, despite record low interest rates. Flooding the system with liquidity won't raise asset prices if there is no pickup in the velocity of money.
- The mission of the Fed and the US Treasury is to raise asset prices and devalue the dollar. If QE can't do it, do you think that means prices have to fall? No. It's like the mother who says to the child who won't eat their vegetables, "look I offered you candy if you would eat the vegetable. Now the games are over, now I'm just going to make you eat it." Mother then grabs you by the hair and sticks your face in your plate and forces you to eat your vegetables.
- Likewise, if the QE carrot won't entice banks and businesses to raise home prices thru a spend and lend scheme (although Dr. Bernanke never does elaborate on exactly how we get house prices to the sky while other prices fall), then Dr. Ben together with Tim Geithner, will MAKE those prices higher with an accounting move called gold revaluation. The other name for it is dollar devaluation. It mechanically makes prices higher, and impoverishes creditors and team paper money, but that's a minor side effect in the eyes of the banksters.
- Who says the gold swapped into the BIS is gold price negative? What if that pile of gold is used to revalue gold higher against a major paper money currency? Is that gold-negative? Is this like when the central bank managers sold the taxpayers' gold to the banksters in the 1990s, and everyone said the selling was gold-negative? What happened then?
- Answer: The taxpayers were roasted while the banksters made billions, as gold soared after the selling was completed. Those billions could become trillions, depending on the amount of paper money that needs to be devalued to reverse the asset price destruction death spiral.
- With a quadrillion dollars of paper money in OTC derivatives outstanding (with aprox $300-$500 trillion of it likely worthless and hidden), I would suggest there's a "fair bit" of paper money devaluation required, a fair bit of gold price revaluation required. There's two sides to every trade. The one you're told about 500 times a day by the media, and the other side, the winning side. In this case there's the swapper and the swappee, so to speak. Are you sure those with the gold are on the losing side of the trade?
- Attention stock market wedge fans: Remember when so many stock market bears said there was an upwedge on the Dow last year? I said there was no wedge, only some wedging action within a parallel up channel. The Dow soared. Now there is another wedge forming. A downwedge, which is bullish. Dow Wedging Action
- The Dow could take out the recent lows by falling away from "around now", and that would actually increase the size and power of the downwedge, provided price didn't blow below the blue demand line by a big margin. A wedge is defined simply, by converging supply and demand lines drawn across highs and lows. Never draw a downwedge starting with a low point from the previous uptrend, nor an upwedge starting with a high point from the previous downtrend.
- That is the error the Dow upwedge people made, a technical one, and they then watched in horror as the Dow soared THOUSANDS of points higher, blowing their wedge trades out of the water. This year stock market hurricane season looks to be less dramatic than usual, but wouldn't bet money on my view. I personally like to stand aside during the aug-sep-oct period, provided I'm exiting my positions at a profit. Core positions can be held, and are by me right now, with an eye to accumulating Dow trading positions on any aug-sep-oct price weakness.
- The Dow has been up about 6 days in a row. The major markets tend to move somewhat in sync, in time, if not in direction. SuperStats man Mark Hulbert reports that the average Dow timer is currently net short the dow, not long! The bankster game to move "Elmer Fudd" Public Investor into 100% cash, into their paper money devaluation blast furnace as stated by Ben Bernanke in writing, is proceeding at a rocket pace, probably even better than they expected! I don't think the average investor understands what is about to happen to them. Paper money is a safe haven from equity market volatility, NOT a safe haven from financial system risk. The move to cash is a knee-jerk panic, not a rational decision. There is one safe haven from system risk; GOLD.
- Let's take a look at the USD Monthly Chart I don't want to beat on the USD paperbugs. (I don't believe it's fair beating on a downed opponent). Still, what is sitting there on that chart is a massive symmetrical triangle. Notice the transition from 92 to 70 to 89 to 74 to 88. Symmetrical triangles have a 2/3 chance of confirming the trend; if the trend was down going into the triangle (it was), then the odds are 66% that the price battle is resolved to the downside.
- I'll add that an argument can be made that the high in the 92 zone is not a valid part of the triangle; the low at 70 is the start of it. That's debatable, and doesn't negate the existence of the triangle. On the bull side, the recent high at 88 could be taken out with a rally from the current oversold position on the short term daily chart.
- Personally, I don't buy breakouts. I sell them. If the US dollar leaps over the supply line and/or the highs at the 90 area, you want to be booking profits on any USD longs, adding shorts, and buying gold, not signing up for a stint in the papermoney blast furnace.
- Remember, those with $1200 strike price gold put options are sweating it now.
- Gold Strikes Chart
- All this H&S pattern does is signify that a run towards $1250 COULD occur. The odds favour the banksters trying to halt price there, as they are the main writers of the huge numbers of $1250 call options you can see on the gold options chart above.
- I'll leave you with this updated version of the rush for the "line" on the Gold chart.
- Gold Rushes The Line !! Remember, if we go thru that line on the upside, you want to be an immediate seller, an immediate booker of profit. Not because you are calling a top, but because is tactical professionalism.
- Special Offer for Website Readers: Send me an Email to freereport4@bell.net and I'll rush you my free Kachingo Mania report! If you didn't buy into 1185 you can't be ringing your cash register now. I'll include my top 5 "market feel" factors that helped me identify the exact low point at 1185, which I labelled "possibly, the new 905" ! Thanks!


