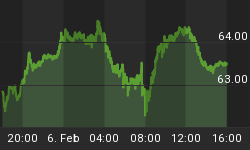
The market continues upward in either a C wave or Wave 2 corrective upside re-tracement if I'm correct. In reviewing the pattern since the April top this year, we have had clear Fibonacci re-tracement levels of the 13 month rally. These occurred at 1040 and 1011 areas so far, 31% and 38% Fibonaci re-tracement levels of the Fibonacci 13 month rally.
Some are saying the market just bottomed at 1011 at the 38% re-tracement area, but the Elliott wave patterns that I rely on do not appear to me to be complete. I could still be wrong and we keep on climbing here and I get egg on my face, certainly possible. However, you don't normally get a straight 8 of 9 days down pattern to 1011 like we just saw and then end a correction there as a C wave in an A B C pattern. C waves are made up of either 3 or 5 waves within, and that was one clear wave down. These happen in fast moving markets and lead to a rare correction pattern called a "running" correction.
In the video which is free to view off my website below, I educate and illustrate on how these look and apply it to the current state of the Market. I'm looking for the following MAX topping areas for all three indices. Dow 10450, Nasdaq 2295, and SP 500 1104-1115. We are within 1-2 % here of a nice reversal to the downside that can be played via shorting. The ultimate target remains 942 on the SP 500 index, and of course those are the 50% Fibonacci downside levels of the 13 month rally, and would fit neatly into the first 180 point SP 500 drop from 1220-1040. This means 1130 is the recent major B wave top, and 180 points from there is about 950 to complete the correction pattern in this bull market. I am looking for sentiment to turn pretty negative again shortly.
Please review to get updated. This current rally has hit 1099 on the SP 500, past the 1092 area I saw the sliver gap on, but below the 78% re-tracement area as well, this 7 day rally is getting long in the tooth. Options expiry week makes it even harder, reminds me of my Mid April top call in fact here on Kitco.Com, it wasn't long before the market rolled over hard. I am looking for the same here as well.


