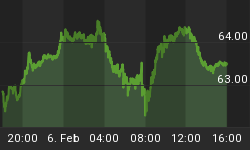
Yesterday the chart above was issued with the following comments:
The market has a few possibilities. A rally/bounce could emerge with ease but either way we would not like to see a snap of the red trend line otherwise 10,000 would be set alight.
Likewise the index can issue a short term dead cat bounce in which 10400-10500 is seen again from which the market would simply plummet down to 10,000.
Should the market issue a v-shape rally back up then we would feel this needs to start no later than before tomorrow's U.S. stock market open or within the first 30minutes of the open.
The Friday Factor
We wanted a rise to start before today's open but this didn't materialise so although attempts were made in trying to turn positive, upside all in all failed.
So what now? The good news that even after today's 58 point Dow Decline the red trend line above has held for the session.
Let's take a look at the chart below with the updated action:

We can see with this four hour chart that we don't have only one supporting trend line at play but also a dissecting support line which coincides with the same area to support the market.
Clearly at TMS we feel the next 350 point move could well be decided here. We either head back up or slip to 10,000 and it is these lines that should provide the move.
Holding and we head higher, folding and we dive lower...
Friday's session could be critical for the weekly charts along with the session in itself on the whole as the Friday factor will decided where the next big move comes from!
Euro....
Yes we will take all the plaudits for screaming buys all over the place with the Euro at 120's but now that we've come to are targets and backed off, do we put in a v-shape move higher or double the recent decline?
Euro Four Hour Chart

Once again just like the Dow Jones the Euro also has two supporting lines for price action shown on the four hour chart above! Firstly we have the bigger red trend line which has the price action for the entire move from the lows above it. Then we also have the intersecting support line in which both lines wrap up at the same junction. Either we snap and double the decline or we hold for a nice v-shape!
The Friday Factor will also be valid for the Euro in which the trading day could be huge in deciding the next big move!
My name is Ajit Singh and my work with the financial markets started at the young age of 17. You could follow the market moves with our live TMS system signals in our live trading room and via email alerts.
www.tradingmarketsignals.com has nailed +512 points already for the month of August with our TMS system in which ALL our members have accessed these signals live and that's only from the five major markets that we follow; Dow Jones, FTSE100, GBP.USD, EUR.USD & Crude Oil. Please note that the significant total of August gains has NOT been incurred from the past few days major market moves!
To obtain analysis of this kind with TMS system signals that produce REAL market moves, it would probably be wise to look at the link for membership below in which you can join the TMS private member community.
As the months move forward TMS is becoming more of a haven for institutional investors, with this in mind retail traders will find this to be the perfect time to come on board as no doubt the institutional side will become our primary focus.
At TMS we have just opened our live trading room where the signals are not just for the position style suitors but also for the intraday and short term traders!
Membership offer ends after the U.S. market closes on the 31st August 2010: http://tradingmarketsignals.com/#/tms-annual-membership-offer/4542738012


