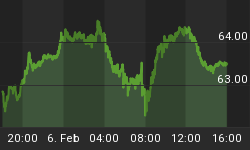
The good news is:
• NYSE new highs are increasing rapidly.
• There will be a good buying opportunity when this declineends.
Net Field Trend (NFT) was developed by Joseph Granville. It is calculated by subtracting the number of issues in negative trends from those in positive trends. A positive trend is defined as two progressively higher highs and higher lows in On Balance Volume (OBV) while a negative trend is defined as two progressively lower highs and lower lows in OBV. OBV is calculated by subtracting the total volume of an issue from a running total on down days and adding it to the running total on up days.
The chart below shows the Russell 2000 (R2K) and the NFT of its component issues. The first group of arrows point to two index lows earlier this year that were unconfirmed by NFT, both were followed by significant rallies. The last arrow points to NFT making a new low on Friday suggesting there is more to the downside of this move.

Summation indices (SI) are running totals of oscillator values. When an oscillator is above 0 the SI rises, when it is below 0 the SI falls. The chart below shows SI's from oscillators of NASDAQ advances and declines, new highs and new lows and upside and downside volume. When these indicators are all heading in the same direction it is imprudent to bet against them and they are all heading downward.

Last Friday was options expiration. As the tables below show, the week after July options expiration has not been favorable to stocks.
The week after July options expiration.
The number following the year is its position in the presidential cycle.
| R2K | |||||
| Year | Mon | Tue | Wed | Thur | Fri |
| 1989-1 | -0.52% | -0.12% | 0.35% | 0.48% | -0.06% |
| 1990-2 | -2.36% | 0.22% | 0.28% | 0.24% | -0.55% |
| 1991-3 | -0.26% | -0.68% | -0.63% | 0.23% | 0.06% |
| 1992-4 | 0.07% | 0.93% | 0.78% | 0.44% | 0.47% |
| 1993-1 | -0.55% | 0.05% | -0.03% | -0.49% | 0.24% |
| 1994-2 | -0.01% | -0.13% | -0.66% | 0.11% | -0.24% |
| 1995-3 | 0.98% | 0.45% | 0.48% | 0.89% | 0.16% |
| 1996-4 | -1.21% | -1.87% | -1.26% | 1.23% | 0.96% |
| 1997-1 | 0.03% | 0.29% | 0.87% | 0.25% | -0.07% |
| 1998-2 | -1.24% | -1.30% | -0.32% | 0.78% | -2.27% |
| 1999-3 | -0.84% | -1.69% | 0.24% | -0.69% | -0.69% |
| 2000-4 | -1.62% | 0.02% | -0.10% | -2.37% | -2.27% |
| 2001-1 | -1.07% | -1.75% | 0.58% | 1.69% | -0.01% |
| 2002-2 | -1.70% | -4.13% | 4.01% | -0.12% | 1.10% |
| 2003-3 | 1.06% | -0.05% | -0.17% | 0.68% | -1.67% |
| Avg | -0.62% | -0.65% | 0.29% | 0.22% | -0.32% |
| Win% | 27% | 40% | 53% | 73% | 40% |
| SPX | |||||
| Year | Mon | Tue | Wed | Thur | Fri |
| 1989-1 | -0.66% | 0.06% | 1.25% | 1.17% | 0.05% |
| 1990-2 | -1.74% | 0.14% | 0.37% | -0.33% | -0.69% |
| 1991-3 | -0.35% | -0.90% | -0.21% | 0.61% | -0.01% |
| 1992-4 | -0.01% | 1.45% | 1.13% | 0.40% | 0.07% |
| 1993-1 | 0.06% | 0.29% | -0.03% | -0.60% | 0.58% |
| 1994-2 | 0.23% | -0.30% | -0.50% | 0.22% | 0.11% |
| 1995-3 | 0.54% | 0.80% | 0.09% | 0.64% | -0.41% |
| 1996-4 | -0.78% | -1.09% | -0.04% | 0.72% | 0.75% |
| 1997-1 | -0.25% | 0.62% | 1.06% | 0.21% | -0.75% |
| 1998-2 | 0.57% | -1.48% | -0.45% | 1.58% | -1.95% |
| 1999-3 | -0.78% | -2.17% | 0.16% | -1.33% | -0.30% |
| 2000-4 | -1.07% | 0.70% | -1.50% | -0.19% | -2.05% |
| 2001-1 | -1.64% | -1.63% | 1.61% | 1.04% | 0.24% |
| 2002-2 | -3.29% | -2.70% | 5.73% | -0.56% | 1.69% |
| 2003-3 | -0.22% | -0.73% | -0.18% | 0.29% | -1.03% |
| Avg | -0.63% | -0.46% | 0.57% | 0.26% | -0.25% |
| Win% | 27% | 47% | 53% | 67% | 47% |
I expect the major indices to be lower on Friday July 23 than they were on Friday July 16.


