


9/2/2010 9:11:09 AM
China reports better than expected factory activity and U.S. markets follow Asian and European markets higher...
Recommendation:
Buy shares of DIA at a limit of $102.80.
Buy shares of QQQQ at a limit of $44.76.
Buy shares of SPY at a limit of $108.46.
Daily Trend Indications:

- Positions indicated as Green are Long positions and those indicated as Red are short positions.
- The State of the Market is used to determine how you should trade. A trending market can ignore support and resistance levels and maintain its direction longer than most traders think it will.
- The BIAS is used to determine how aggressive or defensive you should be with a position. If the BIAS is Bullish but the market is in a Trading state, you might enter a short trade to take advantage of a reversal off of resistance. The BIAS tells you to exit that trade on "weaker" signals than you might otherwise trade on as the market is predisposed to move in the direction of BIAS.
- At Risk is generally neutral represented by "-". When it is "Bullish" or "Bearish" it warns of a potential change in the BIAS.
- The Moving Averages are noted as they are important signposts used by the Chartists community in determining the relative health of the markets.
Current ETF positions are:
In Cash.
Daily Trading Action
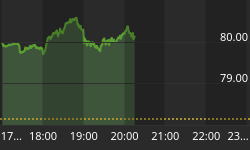
The major index ETFs opened significantly higher and after hovering for the first fifteen minutes, took off to the upside and kept going higher soaring even more after the 10:00am EDT release of a bullish economic report. The major indexes began to flag in late morning trading and eased downward through much of the rest of the session but regained a bullish tilt in the final hour to close not far below their intraday highs. This left all three major indexes in trading states joining the Russell-2000 (IWM 62.51 +2.33) which gained an outstanding +3.9% on the day. The Semiconductor Index (SOX 316.75 +9.26) rose +3.0% on the day, essentially matching but not leading the major indexes higher. It also remains in a downtrend state, but did close back above its 400-Day Moving Average (DMA). The Bank Index (KBE 22.47 +0.87) rose 4.0% as it found support at its 400-DMA. The Regional Bank Index (KRE 21.99 +0.87) rose 4.1% to close just under its 400-DMA and joined the bank index as it moved into a trading state. The 20+ Yr Bonds (TLT 106.00 -2.56) lost 2.4% as the bloom fell off the rose as market participants decided that equities may be more attractive than fixed income investments. NYSE volume was a bit below average with 1.167B shares traded. NASDAQ share volume was average with 2.125B shares traded.
In addition to crude oil inventories, there were three economic reports of interest released:
- ADP Employment Change (Aug) came in at -10K versus an expected +13K
- Construction Spending (Jul) fell by -1.0% versus an expected -0.7% fall
- ISM Index (Aug) came in at 56.3 versus an expected 52.9
The first report was released more than an hour before the open and market participants essentially ignored it in favor of the overwhelming bullishness seen in foreign markets. The other two reports were released a half hour after the open and while Construction spending was largely in line with weak expectations, the ISM Index was surprisingly strong. Economists has expected a drop from July's 55.5 reading and instead manufacturing activity increased. This provided a lift to an already buoyant market.
Global markets continue to trade in tandem. After China reported an unexpected rise in a purchasing manager index, the first such rise in the last four months. Australia reported growth of 1.2% in the April-June quarter based on commodities exports. All of this suggests that the global economy may be stronger than suspected and therefore the bulls are in a buying mood. The key, of course, will be the non-farm payrolls that will be reported and hour before the markets open on Friday. With the poor showing in the ADP report, you would have though investors would be more concerned but clearly sentiment has shifted to the glass is half full. It should also be noted that the ADP reports tend to be more bearish than those published by the U.S. government so the Friday payroll numbers may not be as bearish as the ADP report would suggest.
All ten economic sectors in the S&P-500 moved higher led by Industrials (+3.9%) and Financials (+3.9%) and with Energy (+3.6%) also making a strong showing.
Implied volatility for the S&P-500 (VIX 23.89 -2.16) fell more than eight percent and implied volatility for the NASDAQ-100 (VXN 24.93 -2.52) fell more than nine percent.
The yield for the 10-year note rose three basis points to close at 2.58. The price of the near term futures contract for a barrel of crude oil rose $1.97 to close at $73.91. The weekly U.S. government's crude oil inventory report showed a rise of 3.42M barrels. In general, when crude oil inventories rise significantly, the price of crude oil moves lower. This move is likely related to a falling dollar and technicals in the way oil is trading, rather than a reaction to this report.
Market internals were positive with advancers leading decliners 5:1 on the NYSE and by nearly that margin on the NASDAQ. Up volume led down volume by more than 20:1 on both the NYSE and the NASDAQ. The index put/call ratio rose 0.09 to close at 1.24. The equity put/call ratio fell 0.25 to close at 0.49.
Commentary:
Wednesday's trading saw a mad rush to get long with the major indexes opening up more than one percent (how many times will we see these large gap openings?). The market gapped up based on Asian and European markets trading higher before U.S. markets opened. The run continued prior to the bullish ISM number. Essentially, the markets have been so oversold, they were looking for a catalyst and they received several. Of course, ignoring the ADP payroll report was a sign of this, as it suggested that tomorrow's non-farm payrolls report isn't going to be as positive as expected.
We continue to see the semiconductors entrenched in a downtrend state, which is somewhat bothersome. This latest pop was led by financials, which are a very important (and the largest) sector in the S&P-500. It appears that some of the risk trade is on (Russell-2000 and NASDAQ-100) but the semiconductors have really fallen outside of the leadership group. As we stated after Tuesday's close, the markets appear ready to break out of their funk and we want to get long (as a trade at least). Accordingly, we will place limit orders to buy at Wednesday's closing prices. We aren't yet going to add to the value portfolios.
We hope you have enjoyed this edition of the McMillan portfolio. You may send comments to mark@stockbarometer.com.


