


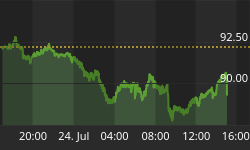


Gold continues to climb. It's not exuberant and it's not exciting but it keeps on climbing. It's at a point where one would expect a serious reaction or a new explosion on the up side. Which will it be?
Barron's Gold Mining Index (BGMI)
Last week I read an article where this Gold Index was a feature. For those who don't know Barron's magazine it is weekly financial journal founded by Clarence W. Barron in 1921 as part of his Dow Jones & Co. empire. He bought the company in 1903 shortly after the death of Charles Dow. Prior to the dawn of the internet THIS was the go-to weekly newspaper for all the information of what went on in the markets. I'm surprised that the paper version is still publishing but I see that they are getting more internet savvy.
From the middle of WW2 (1942) to the beginning of 1980 this Index was in a major long term bull market with its inevitable ups and downs. It gained about 70 times in price during that period. Since the peak in 1980 it has done nothing. In 2008 it did make a new high but barely. It has since come back down from that high and as of last Friday's close it is at a lower level than where it was in 1980. In late 2007 when this Index finally made a new all time high there were glowing articles by followers of this Index of a new major bull market in gold stocks. It wasn't long before the Index took a turn and dropped over 60%. So much for THAT bull market. Looking at a shorter term chart of the Index, it has been moving sideways for about a year now and should it move higher it could break into a new bull phase, but that remains to be seen.
Although my Merv's Indices do not go back as far as the BGMI does my Merv's Qual-Gold Index does go back to early 1980. At that time it made a high of 15.75 before plunging more than two thirds in price. By its high in 2008 this Index was at 99.37 or 530% above its 1980 high. At the close on Friday it stood at 118.40 or a further 19% above its 2008 high. The average quality stock has been doing quit well although one would not have known so by following the BGMI.
GOLD
LONG TERM
The long term indicators continue to be positive as gold continues to climb higher. Gold is above its positive sloping moving average line. The momentum indicator continues in its positive zone above its positive sloping trigger line. The volume indicator continues to move higher into new high ground and above its positive trigger line. All in all the long term rating remains BULLISH.
INTERMEDIATE TERM
All systems are go on the intermediate term although there is some concern here. The price of gold remains above its positive moving average line. The momentum indicator remains in its positive zone above its positive trigger line and the volume indicator continues to move above its positive trigger line. So what is the concern?
The intermediate term momentum indicator, although positive, is showing signs of a weakening in the recent price action. Although the price is almost back to its June highs the momentum indicator is not all that strong and falling behind. As previously mentioned in these commentaries the June highs in price, versus the previous highs in late 2009, was not confirmed by the momentum which peaked at a lower level than its value in late 2009. We are now seeing an even lower momentum value as the price edges towards new highs. This negative divergence needs to be solved by a spurt in the momentum above previous levels or else the price move may be suspect. In the mean time the indicators are still showing a positive trend and the rating remains BULLISH. The short term moving average line is above the intermediate term line for confirmation of this bull.
SHORT TERM
As with the other time periods the short term indicators are also looking good. The price trend has been towards the up side for over a month now and the action has given us a well defined up trending channel. As always, when we have the trend trapped in one of these channels we assume the trend stays in motion until it breaches the channel lines, above the resistance or below the support. The short term momentum indicator continues to trend higher inside its positive zone but not with the vigor of the price trend. Although the price is getting very close to its previous all time highs the momentum still has a lot more work to do to reach its previous highs. As for the daily volume action, it is along the lines of pathetic. The whole advance over this past month has been on very low volume action, action that is at its lowest continuous level for a long time now. Bull trends do not normally have great longevity on very low volume action. Still, going by the indicators alone the rating remains BULLISH with the very short term moving average line confirming the bull by remaining above the short term line.

As for the immediate direction of least resistance, that is again a toughie. The Stochastic Oscillator is in a topping mode and one might even say it has topped out with the trend now towards the down side. It has also given us a short term negative divergence. Although the price trend itself is still to the up side it does look like it may be coming to an end. I will go with the lateral direction for the next day or two although it does look like the down side has the upper hand going forward.
SILVER
The Friday close was the highest close for silver since its brief spurt into the $20s during March of 2008. The P&F chart doesn't show this new high because of the units used. The price would need to hit $20.00 for the P&F chart to show a new high. It hit $19.99 on Friday, short by one cent. But that's the way of the P&F charts.
For the past few weeks silver has been acting better than gold. The performance of silver shown in the Precious Metals Indices Table does not show it (or gold) in true light. Stocks always have a magnifying effect versus the metal so the stock indices should normally show a better performance than the metals. However, if you go to my Merv's Non-Edibles Futures Indices Table there you will see the performance of gold and silver versus other non-edible futures. You can find this table at www.preciousmetalscentral.com. Go to the Free Weekly Comment section and click on the Non-Edibles Futures link.

In that table silver is shown as the number one performer for the short term, number 2 for the long term and number 7 for the intermediate term. In all cases it has a superior performance to that of gold (Palladium is the number 1 for the intermediate and long term performance). As with gold, the ratings for all three time periods are BULLISH but with the same caution as gold. The momentum indicators are showing negative divergence and need to be resolved.
The performances of the silver stocks are interesting. The quality stocks are seriously under performing all other of the Merv's Indices and the Merv's Qual-Silver Index is still some 30% below its 2008 high. The more speculative silver stocks are, however, performing magnificently with the Merv's Spec-Silver Index now some 30% above its 2008 high. What a difference in the two performances. This week alone, the Qual-Silver Index climbed 1.5% while the Spec-Silver Index climbed 8.2%. When the speculative stocks are still going great the bull market has not yet seen its final high.
PRECIOUS METAL STOCKS
It was generally a good week although you would have to be looking at the Merv's Indices to know that. The popular North American Indices had a hard time staying positive with the PHLX Gold & Silver Sector Index showing the best weekly performance with a 1.5% gain. The Merv's Indices were all over the place this past week with performances of 1.1% for the Merv's Qual-Gold Index at the bottom and a gain of 8.7% for the Merv's Gamb-Gold Index at the top. One stock in the Gamb-Gold Index that helped it to that 8.7% Index gain was a super performer with an individual gain of 146.9%. It went POS in the ratings in June at $1.56 and closed this week at $6.00. A gold strike will do that to a stock although I'm only guessing here.
I was glad to see the Merv's Penny Arcade Index once more moving into new all time high territory. It had been lagging lately. The only cautionary indicator is the momentum indicator which is still considerably weaker in its performance versus that of the Index itself. However, as long as the pennies are moving all remains well with the universe of gold and silver. This week almost half of the Penny Arcade component stocks made double digit gains.
As mentioned in the previous section, the speculative silver stocks are doing great. Only one of the 30 Spec-Silver Index stocks closed the week on the down side. All others were in the plus side with 40% of them double digit gainers.
Things couldn't get any better. Just about time for a negative surprise.
Merv's Precious Metals Indices Table

Well, that's it for another week.


