


We don't provide a day trading system. I am a probability trader that has modified a system that gives you an opportunity to learn to fish. The value we provide is in understanding setups and managing risks. However, there are times when I will give you a fish and other traders here will do the same. Also, please remember that this is about probabilities, not certainties.
My goal would be an "Elliott Wave for Dummies" curriculum. I love all the "for Dummies" books because they strive to simplify and clarify. They are profoundly simple. The mark of a good teacher IMO is someone who can get the hay down from the loft so the horses can eat it. Many teachers like to complicate their subject matter so they can appear "smart". I have no use for insecurity in teachers. The old saying that "it's better to teach someone to fish than give them a fish" is never more true than in teaching.
To that end, the best way to see what we do on a daily basis and on an intraday basis is to try our Premium Content. If this site doesn't add back more than the price of admission, then you have no obligation to subscribe after one month, and you will have still learned some Elliott.
If you like what you see here, wait to see how MortiES's analysis can assist you in your everyday investing or trading strategy! Go ahead, check out my track record and Click on "Subscribe to MortiES Premium" and give it a try! I am offering a 30 day free trial period.
Yeah it is the weekend! If you want to shadow trade with us.. stocks and ES (E-mini futures) http://www.bostonwealth.net/2010/08/15/trading-profits-of-almost-100000-in-5-weeks/
Give us a try as well. Please go here http://vpi.groups.live.com/
If you don't have a windows live account, create one first.
Then from the above link, ask to be invited to the instant message chat.
Monthly subscription required and will be discussed during invitation.
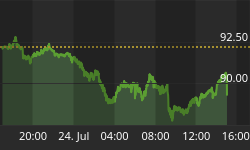
ES has been crawling higher, delaying a correction that is inevitable. So we are waiting for the fat lady to sing and announce that W3 is over and a substantial W4 is underway. I warn against being premature with a short, since timing is everything. My charts are always a little funky around contract rollover dates since the continuous symbol does not always chart out the same as the current contract and the underlying index. I am using the December contract for my charts. I think it is the most accurate data.
The Daily chart below has arrows on it that are meant to give general information. For example, the first arrow is a red arrow down, but that does not mean I expect the market to correct Monday. Rather it means that ES could go higher before correcting down to the MA's for support - or it correct without going higher. The next chart will explain that more. The green highlighted zone on this chart is target-rich, and however ES does it, I expect it will make it to that level before long. I also expect a big fight in that area as the Bears try to regain control and push this market lower. But we are daytraders and tomorrow is the most important projection to have correct!

My second chart is not a really short time-frame, but it is the best one for me to show what I am seeing. The count on this chart are highlighted with my own labels. I've included W3's fractal count for those who have been following the posts closely and want to know where we are relative to the counts we were using last week. The big question is whether W3 is complete. Since ES has been crawling higher by hugging the 15 EMA (blue line), it is possible for it to continue that climb. I am going to be using the 15 EMA as a trigger for the beginning of W4. In this scenario, W3 could extend with W5 of W3 crawling higher in an ending diagonal type of pattern. The arrows on this chart are meant to indicate that ES could crawl higher (green dashed) or it could correct in a W4 (red arrows). The correction I have drawn on this chart is only valid if W4 begins now. If it begins higher, we will simply regenerate the W4 targets from the new end of W3. So, please don't trade these arrows unless ES tells us to. For example, if trading opens Monday morning with ES below the 15 EMA, then I would look at the red arrows as a reasonable projection for W4.

If you like what you see here click on "Subscribe to MortiES Premium" and give it a try! I am offering a 30 day free trial period.


