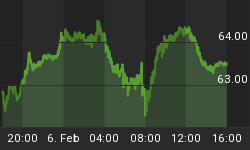
9/22/2010 9:12:54 AM
The Federal Open Market Committee (FOMC) announced no change in interest rates and the policy statement arrived as expected...
Recommendation:
Take no action.
Daily Trend Indications:

- Positions indicated as Green are Long positions and those indicated as Red are short positions.
- The State of the Market is used to determine how you should trade. A trending market can ignore support and resistance levels and maintain its direction longer than most traders think it will.
- The BIAS is used to determine how aggressive or defensive you should be with a position. If the BIAS is Bullish but the market is in a Trading state, you might enter a short trade to take advantage of a reversal off of resistance. The BIAS tells you to exit that trade on "weaker" signals than you might otherwise trade on as the market is predisposed to move in the direction of BIAS.
- At Risk is generally neutral represented by "-". When it is "Bullish" or "Bearish" it warns of a potential change in the BIAS.
- The Moving Averages are noted as they are important signposts used by the Chartists community in determining the relative health of the markets.
Current ETF positions are:
Long at DIA $102.80
Long QQQQ at $44.76
We are long Oct $106 DIA puts at $185 per contract ($1.85 per share) on Friday, Sept 17th.
We are long Oct $48 QQQQ puts at $94 per contract ($0.94 per share) on Friday, Sept 17th.
We are long Oct $113 SPY puts at $231 per contract ($2.31 per share) on Friday, Sept 17th.
Daily Trading Action
The major index ETFs opened flat and at the open immediately moved lower but stopped within fifteen minutes and spent the next five hours range bound trading sideways up and down in a narrow field. At 2:15pm, when the FOMC interest rate decision was announced, the market moved higher for a half an hour then spent the rest of the session moving lower. The Dow finished modestly higher (about a tenth of one percent), the S&P-500 finished about two tenths of one percent lower, and the NASDAQ-100 finished essentially flat. The Russell-2000 (IWM 66.63 -0.39) lost a fair amount of ground while the Semiconductor Index (SOX 335.29 -0.83) posted a nominal loss. The Bank Index (KBE 23.45 -0.31) lost more than one percent while the Regional Bank Index (KRE 22.83 -0.19) lost a similar amount and moved back down to its 50-Day Moving Average (DMA). The 20+ Yr Bonds (TLT 103.68 +1.42) tacked on more than one percent as investors, once again, choose the relative safety of bonds on heavy volume trading. NYSE volume increased but was still around average with 1.040B shares traded. NASDAQ volume increased slightly but was still average with 2.105B shares traded.
In addition to the FOMC policy announcement, there were two economic reports of interest released:
- Housing Starts (Aug) came in at 598K versus an expected 550K
- Building Permits (Aug) came in at 569K versus an expected 560K
Both reports were released an hour before the open and although both beat expectations, had little effect on futures.
The Federal Open Market Committee (FOMC) announced no change in interest rates and the policy statement arrived as expected. That is, at 2:15pm, the wording of the policy statement was released and it didn't provide a whole lot of new information. Kansas City Fed President Hoenig continues to be the lone dissenter but the rest of the committee voted to continue the low rates for an extended period and essentially maintained that they would be vigilant and are prepared to take further measures, with the market anticipating further quantitative easing by buying U.S. treasuries.
Telecom (+0.3%), Industrials (+0.2%), and Healthcare (+0.1%) advanced while the other seven of ten economic sectors in the S&P-500 moved lower, led by Financials (-1.0%).
The U.S. Dollar declined 1.0% today. That usually causes U.S. equity markets to move higher. Stay tuned on that.
Implied volatility for the S&P-500 (VIX 22.35 +0.85) rose four percent as the S&P-500 as did implied volatility for the NASDAQ-100 (VXN 23.26 +0.83). The rise was significantly greater than the decline in the underlying indexes suggesting that option writers are demanding more of a premium.
The yield for the 10-year note fell twelve basis points to close at 2.59. The price of the near term futures contract for a barrel of crude oil rose eleven cents to close at $74.97.
Commentary:
Tuesday's trading saw an increase in volume, a spike in implied volatility, negative market internals and stymied price action. The set-up for the markets to roll-over here is now in place. We have a bearish divergence (a weak one) between price action and key indicators for the NASDAQ-100 and S&P-500. We lack confirmation for these indexes and for the other equity indexes we regularly monitor.
We are also watching the bank indexes, which weakened as financials led indexes lower. While the bank indexes are still not showing a BULLISH BIAS, they are close to changing. The bank indexes and Semiconductors are in trading states while the major indexes and Russell-2000 are in uptrend states. Which way with the equity markets choose? It could go either way, which is why we are hedged.
We hope you have enjoyed this edition of the McMillan portfolio. You may send comments to mark@stockbarometer.com.


