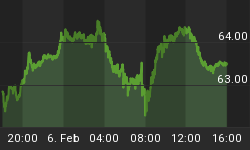
Bonds extended the rally slightly (2.55% on the 10y note), while equities took a small breather (-0.5%). Stocks only retraced back to the top of the breakout range, and didn't sink back into it, so no real technical damage has been done.
There wasn't much reason to expect any damage, although the FHFA House Price Index was significantly softer-than-expected. This index doesn't typically move markets, but the miss was not small: -0.5% versus -0.2% expected, month-on-month, and last month revised from -0.3% to -1.2%. That sunk the y/y rate to -3.3% (see Chart). After briefly leveling off late in 2009, home prices have continued to slide as foreclosure properties are finally coming through the pipeline onto the market.

The bounce in home prices may be a dead-cat bounce.
Now, 3.3% declines in home prices will not have the same depressing effect on rents that the 9-10% declines did, but it won't push rents higher, either. This suggests that core (including housing, which relies on rents and the rental equivalence of ownership) may well rise more sluggishly than it otherwise would, although I believe that core inflation overall is nevertheless in the process of bottoming over the next two months.
The fact that core inflation has a chance of hitting 0.8% or even 0.7% in the next two months (although probably not until after the November meeting), even if that is going to be the low and even if core inflation ex-housing begins rising more briskly, helps set the table further for QE2. I still think that further aggressive Fed action will only be likely to happen if the fiscal tsunami due to wash over this country early next year is not diverted by Congress in the next month or so, but it is plain that continued low inflation (and especially further deterioration) is helpful to the case. I have to share here (without permission) a great limerick that a lyrically-gifted friend (Andy F) posted in reply to my column yesterday:
The Fed said inflation not growth
Is the critical part of our oath
If it weakens anew
Then here comes QE2
Unemployment? We can't handle both
With the weak housing data, you wouldn't think it would make sense that TIPS would rally hard but TIPS have been on fire recently. I noted a week or two ago that European inflation markets had been suddenly perky, and that the US was showing signs as well; however, in recent days it has been very much a real rate phenomenon and not an inflation-swap phenomenon so much. The chart below shows Bloomberg's on-the-run 10-year TIPS yield series, which is plumbing all-time lows (I have the 10y real yield more like 0.69% than 0.65%, but the point of the chart doesn't change).

I guess since real yields can be negative...there is no theoretical bottom to this hole.
As I previously pointed out, some of this is likely due to speculation that Barclays might add TIPS to the Aggregate index, an idea which makes very little sense but it enough to scare bears in the product out of their positions. And rightly so, because if Barclays does make such a change it would mean a massive one-time flow into the asset class as indexers get on their marks (more than likely, Barclays would phase in the change over time so that the Treasury would have time to meet the greater demand with further supply...but there is, after all, no guarantee that the Treasury will choose to do so). I don't know when the formal announcement would come, but it shouldn't be long.
Tomorrow's data includes both the suddenly-vibrant Claims number (Consensus: 450k, unchanged from last week and back near the lows of the 2010 range) at 8:30ET, followed by the suddenly-catatonic Existing Home Sales figures (Consensus: 4.10mm, which would have been an all-time record low if last month's 3.83mm hadn't printed). More important than the rate of Existing Home Sales, which has been really jumpy and so one month probably doesn't mean a lot, will be the count of Homes Available For Sale in the same report. The inventory of existing homes is around 4mm, below the all-time highs of 2007 and 2008 but near the highs of 2009 and 2010. As long as the inventory number remains high, the Home Price Index is going to remain under pressure. The chart below makes this clear. It relates the count of Homes Available For Sale (in millions) with the rate of home price appreciate or depreciation over the immediately-subsequent 12 months (data since 1999). The R2 is probably exaggerated due to the wide range covered by the data, but to me it is still a pretty compelling chart.

More supply? Lower prices.


