


9/28/2010 9:10:56 AM
The day was one of little movement and mostly tedium as there were no catalysts to get a real move going...
Recommendation:
Take no action.
Daily Trend Indications:

- Positions indicated as Green are Long positions and those indicated as Red are short positions.
- The State of the Market is used to determine how you should trade. A trending market can ignore support and resistance levels and maintain its direction longer than most traders think it will.
- The BIAS is used to determine how aggressive or defensive you should be with a position. If the BIAS is Bullish but the market is in a Trading state, you might enter a short trade to take advantage of a reversal off of resistance. The BIAS tells you to exit that trade on "weaker" signals than you might otherwise trade on as the market is predisposed to move in the direction of BIAS.
- At Risk is generally neutral represented by "-". When it is "Bullish" or "Bearish" it warns of a potential change in the BIAS.
- The Moving Averages are noted as they are important signposts used by the Chartists community in determining the relative health of the markets.
Current ETF positions are:
Short DIA at $108.57
Short QQQQ at $49.66
Short SPY at $114.82
We are long Oct $106 DIA puts at $185 per contract ($1.85 per share) on Friday, Sept 17th.
We are long Oct $48 QQQQ puts at $94 per contract ($0.94 per share) on Friday, Sept 17th.
We are long Oct $113 SPY puts at $231 per contract ($2.31 per share) on Friday, Sept 17th.
Daily Trading Action
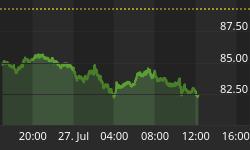
The major index ETFs opened flat and moved immediately down then reversed to move higher much of the morning before again moving lower into the noon hour then higher until they peaked with more than an hour left in the session. The sell-off began and the major indexes managed to lost about a half of one percent on the day. The major index ETF trading was on light volume and in a narrow range. The Russell-2000 (IWM 66.82 -0.17) traded in an even narrower range while the Semiconductor Index (SOX 343.80 -2.34) moved more significantly lower. Surprisingly, the Semiconductor Index in on the verge of entering an uptrend state! The Bank Index (KBE 22.91 -0.38) led the slide lower and the Regional Bank Index (KRE 22.52 -0.27) moved down more than one percent. The Semiconductors and Bank Indexes remain below their 200-DMAs. The bank indexes are in trading states. The 20+ Yr Bonds (TLT 105.30 +1.80) moved sharply higher for the second day and is now back above its 20-Day Moving Average (DMA) and all the other MAs we regularly report on. NYSE volume was on the low end of average with 919M shares traded. NASDAQ volume also decreased slightly but was still average with 1.870B shares traded.
There were no economic reports of interest released. Instead, the session was spent hanging out either side of the unchanged mark until traders that opened long positions early in the session closed them in the final hour of trading. The day was one of little movement and mostly tedium as there were no catalysts to get a real move going. Watching for a tradable move was like watching paint dry.
Telecom (+0.9%) and Utilities (+0.1%) were the only two sectors of the ten economic sectors in the S&P-500 to move higher. Financials (-1.2%) led the other eight sectors lower with Tech (-0.2%) moving down the least.
Implied volatility for the S&P-500 (VIX 22.54 +0.83) rose nearly four percent while implied volatility for the NASDAQ-100 (VXN 23.64 +0.92 rose a full four percent. Both are still below their 200-DMAs.
The yield for the 10-year note fell nine basis points to close at 2.52. The price of the near term futures contract for a barrel of crude oil was nearly unchanged rising three cents to close at $76.52.
Market internals were negative with decliners leading advancers 7:5 on the NYSE and by 3:2 on the NASDAQ. Down volume led up volume 3:2 on the NYSE and by 5:4 on the NASDAQ. The index put/call ratio was nearly unchanged rising 0.02 to close at 1.36. The equity put/call ratio was virtually unchanged ticking up 0.01 to close at 0.58.
Commentary:
Monday's trading wasn't too exciting. Fortunately we were well positioned with the short positions we entered at Friday's close. The key here is that the major indexes will either move higher (which is the consensus opinion) or the major indexes will struggle and begin to break down here. The major indexes are all in uptrend states and the Russell-2000 and Semiconductor Index are on the verge of entering uptrend states. The Bank Indexes look abysmal still and the long-term bond (TLT) is in a definite uptrend state. You have a real battle going on and it isn't possible to know how it will actually be resolved.
We can see things breaking in either direction but we are well positioned to either exit our positions at minimal losses if things move against us or to get full profits on a move to the downside. We are a bit bothered by the lackluster (light volume) action seen on Monday because while price moved in a direction favorable to our positions, the volume didn't confirm the move. We will have to be patient here to see if the bulls will step up yet again to drive equities higher or whether the pessimists will win out and we can get something of a correction started.
We hope you have enjoyed this edition of the McMillan portfolio. You may send comments to mark@stockbarometer.com.


