


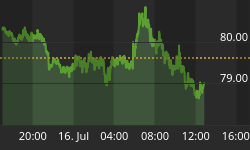


Other than Tuesday it was a pretty good week. There was all that excitement about the $1300 mark for gold but let's get real, it's only a number. We have higher numbers on our mind.
GOLD
This is a busy week-end so the commentary will be pretty short and only the facts.
LONG TERM
As noted above, that $1300 level is just a number. I know many attached some magical meaning to it as I mentioned last week, let's concentrate on $1395 followed by $1600.
Regardless of what one might think is going to happen or should happen in the market a technician's credo is that a trend in motion remains in motion until verified otherwise. So, what is the trend in motion? That's easy. I use simple indicators for the three basic concepts of following the market, i.e. trend, momentum and volume. Putting them together I come up with my assessment of where we are at the present point in time for the three basic investment time periods.
On the long term gold price remains above its positive sloping moving average line so the trend is positive. The long term momentum indicator remains in its positive zone and above its positive sloping trigger line for a positive momentum reading. The volume indicator is moving nicely into all time high territory above its positive sloping trigger line. Putting those together one can easily see that the long term rating, i.e. trend of the gold price, is BULLISH.
INTERMEDIATE TERM
The intermediate term trend in motion is also easy to assess. The price of gold continues to move above its positive sloping intermediate term moving average line. The intermediate term momentum indicator remains in its positive zone above its positive sloping trigger line. The volume indicator continues to move higher and remains above its intermediate term positive sloping trigger line. Here too, putting those together we get a rating or intermediate term trend for gold as being BULLISH. For the intermediate term I also look at where the short term moving average line is relative to the intermediate term line. The short term moving average remains above the intermediate term line for confirmation of the bull rating.
SHORT TERM
We have a similar situation as far as the short term trend in motion is concerned as we had for the other time periods. The Gold price continues to move above its positive sloping moving average line. The short term momentum indicator continues inside its positive zone and above its positive sloping trigger line. Here, we go to the daily volume activity to assess the volume action for the short term. That volume action has been pretty weak versus previous periods.

In fact the daily volume continues below its 15 day average volume most of the time. Despite the weaker volume indication the trend in motion, as represented by the rating, remains BULLISH. Here the very short term moving average is looked at versus its position relative to the short term moving average. The very short term average remains above the short term average, where it has been now for two months, for confirmation of the short term bull.
We have additional indicators that assist in making the final determination of trend. We have here an up trending channel with its support and resistance trend lines and we have a momentum indicator that is now traveling inside its overbought zone. These are additional warning indicators and may at times cause us to be careful in any purchase or sell activities. For now both are suggesting not to be surprised if we get some short term activity on the down side.
As for the immediate direction of least resistance, here I use the Stochastic Oscillator (SO) along with very short term indicators. All are positive but the SO had already crossed back below its overbought line and shot back above the line on Friday. How long it will stay there is anyone's guess. There does not look like much upside left unless gold is going to break above its channel resistance line. For now I'll go with the lateral direction as the most probable for the next day or two.
SILVER
Due to time constraints silver is getting the short shift today. It continues to out perform gold so as can be expected silver remains BULLISH in all three time periods. The latest P&F projection for silver was mentioned last week as being towards the low $30 area so that is where we are heading.
PRECIOUS METAL STOCKS

I have mentioned this Index several times in the past. The Index reflects the average weekly performance of the 30 component penny stocks and is an indication of the speculators interest in the more aggressive gambling variety of stocks. When speculators are very comfortable with the bullish direction of stocks they gravitate towards the more speculative variety. As long as their interest continues in these stocks one can assume that the primary sentiment is still bullish on stocks. These speculators seem to have a better feel for the market and when they start to get uneasy they dump their more speculative (or gambling) stocks first. This they do some time before the general market reflects any direction change in stocks. The last time this Index turned bearish was a year BEFORE the universe of gold and silver stocks turned bearish so we might still look for several months of good times ahead as this Index is still very much bullish. The two other very speculative Indices one can view in the weekly Table at the end of these commentaries are the Merv's Gamb-Gold Index and the Merv's Spec-Silver Index. Both are also in the very top of the short, intermediate and long term performance categories so all are giving the same message for a continued precious metals market advance..
Merv's Precious Metals Indices Table

Well, that's it for this week.


