


Summary of Index Daily Closings for Week Ending August 6, 2004
| Date | DJIA | Transports | S&P | NASDAQ | Jun 30 Yr Treas Bonds |
| Aug 2 | 10179.16 | 3134.15 | 1106.62 | 1892.09 | 108^12 |
| Aug 3 | 10120.24 | 3120.54 | 1099.69 | 1859.42 | 108^25 |
| Aug 4 | 10126.51 | 3119.47 | 1098.63 | 1855.06 | 108^23 |
| Aug 5 | 9963.03 | 3054.83 | 1080.70 | 1821.63 | 109^00 |
| Aug 6 | 9815.33 | 2966.08 | 1063.00 | 1776.89 | 110^27 |
| SHORT TERM FORECAST (Next Two Weeks) | ||||
| TREND | PROBABILITY | Legend | ||
| Substantial Rise | Low | |||
| Market Rise | Medium | Very High | 80% | |
| Sideways | Medium | High | 60% | |
| Market Decline | High | Medium | 40% | |
| Substantial Decline | High | Low | 20% | |
| Very Low Under | 20% | |||
| INTERMEDIATE TERM FORECAST (Next 12 Weeks) | ||||
| TREND | PROBABILITY | Substantial | 800 points+ (DJIA) | |
| Substantial Rise | Low | Market Move | 200 to 800 points (DJIA) | |
| Market Rise | Medium | Sideways | Up or Down 200 (DJIA) | |
| Sideways | Medium | |||
| Market Decline | High | |||
| Substantial Decline | High | |||
This week the Dow Jones Industrial Average closed down 324.38. In this week's Mid-week Market Update, August 4th on www.technicalindicatorindex.com, we stated that the rally since July 26th was weak and that the next leg down - a sharp decline - "could occur any day." It started the very next day. The rally from July 26th to its top on Monday August 2nd retraced a Fibonacci .50 of the decline from June 23rd to July 26th. The rally should have been stronger. For the past several years, wave 2's have retraced at least 61.8% of wave 1's, and often a full 78.6% retrace. This is Bearish.
Volume was up on Friday's huge sell-off, but was not up on Thursday's. Panic selling has not yet occurred and that will be necessary to signal we are near an intermediate-term bottom. New 52 Week lows on the NYSE were 41, 40, 82, 78, and 155 this week, in that order. We should see new lows climb toward the 400 to 500 area before an intermediate bottom is reached.
All the major averages fell - both on an intraday and closing day basis - below their May lows, so the Bearish pattern of lower highs and lower lows is alive and well. The NASDAQ Composite closed at its lowest level since September 2003. We believe equities are crashing.
| Equities Markets Technical Indicator Index (TII) ™ | ||||
| Week Ended | Short Term Index | Intermediate Term Index | ||
| Apr 2, 2004 | (3.00) | (35.61) | Scale | |
| Apr 16, 2004 | (43.00) | (29.90) | ||
| Apr 23, 2004 | 94.00 | (22.69) | (100) to +100 | |
| Apr 30, 2004 | (33.25) | (34.88) | ||
| May 7, 2004 | (28.75) | (47.75) | (Negative) Bearish | |
| May 14, 2004 | (25.75) | (66.45) | Positive Bullish | |
| May 21, 2004 | 22.00 | (67.23) | ||
| May 28, 2004 | ( 3.50) | (48.48) | ||
| June 4, 2004 | (55.75) | (34.07) | ||
| June 11, 2004 | (77.75) | (25.92) | ||
| June 18, 2004 | (40.25) | (31.17) | ||
| June 25, 2004 | (34.00) | (26.10) | ||
| July 2, 2004 | (41.50) | (27.64) | ||
| July 9, 2004 | (32.50) | (30.21) | ||
| July 16, 2004 | (33.75) | (41.99) | ||
| July 23, 2004 | (59.00) | (49.98) | ||
| July 30, 2004 | 46.25 | (52.18) | ||
| Aug 6, 2004 | (38.00) | (50.40) | ||
This week the Short-term Technical Indicator Index comes in at negative (38.00), indicating a market decline is probable. This indicator is a useful predictor of equity market moves over the next two weeks, both as to direction and to a lesser extent strength of move. For example, readings near zero indicate narrow sideways moves are probable. Readings closer to +/-100 indicate with a higher degree of confidence that an impulsive move up or down is likely over the short run. Market conditions can change on a dime, or the Plunge Protection Team can come in and temporarily stop market slides, so it may be unwise to trade off this weekly measured indicator.
The Intermediate-term Technical Indicator Index is useful for monitoring what's over the horizon - over the next twelve weeks. It serves as an early warning system for unforeseen trend changes of considerable magnitude. This week the Intermediate-term TII comes in at negative (50.40).
The chart on the next page blueprints where we've been and where we are likely to be going in the Dow Jones Industrial Average over the next several months.
To review, This Bear Market Began in January 2000 for the DJIA and the move down from then until October 2002 was Primary degree wave 1. Then an A-B-C wave pattern transpired - primary degree Elliott wave 2 up - that concluded on June 23rd, 2004. This date formed a near-perfect Fibonacci Golden phi Ratio in the number of trading days between 1/14/00, 10/9/02, and 6/23/04. Measuring time, primary degree wave 1 down took a Fibonacci .618 of the total number of trading days from 1/14/00 to 6/23/04. Primary degree wave 2 up took a Fibonacci .382 of the total number of trading days from 1/14/00 to 6/23/04. Primary degree wave 2 up concluded with a truncated minute degree wave 5 up of C up. This truncation warned that the Bear was ready to attack with a vengeance. There wasn't enough buying power to push prices up to a higher high for wave 5. It fell short of wave 3's high. This truncation also produced a Bearish upside non-confirmation with the Transportation Average under Dow Theory.

The start of primary degree Elliott wave 3 is a minor degree wave 1 down that should complete sometime in the early autumn. Our next major Fibonacci turn date is scheduled for September 7th, 2004, so that may be a good target date for the bottom of minor degree wave 1. For those unfamiliar with Elliott Wave analysis, to oversimplify, in Bear markets prices tend to move impulsively in a series of 5 waves, in 1-down, 2-up, 3-down, 4-up, 5-down stair-steps. Corrections to impulsive moves - countertrend moves - tend to occur in an A-up, B-down, C-up fashion. There are rules for how these waves are to be counted, and each wave tends to have a unique personality unto itself. For example wave 3 cannot be the shortest wave in a 5-wave impulsive sequence. They are usually the largest moves. Waves B and 4 are generally short or sideways moves, often seen as triangle patterns.
Minute degree wave 1 down completed on July 26th. It was a 574 point move down. Minute degree wave 2 up disappointed, retracing only 50 percent of wave 1. Should minute degree wave 3 down be 1.618 the length of wave 1, that would suggest a target for minute wave 3 of about 9275. If we figure minute degree wave 4 will not have a strong countertrend push, will be some sort of triangular pattern that retraces 38.2 percent of wave 3, then that bounce brings prices back to about 9630. Should wave 5 equal wave 1, then that gets us a target bottom for minor degree wave 1 down of primary degree wave 3 down of around 9055. Now, should this decline be sharper, should either wave 3 down or wave 5 down extend, prices could fall much further. A drop to 9055 would be about a 1500 point decline over about 2 1/2 months - meeting our definition of a crash.
These estimates are conjecture, based upon normal relationships of the past. Markets can do anything so do not bet the house on these estimates. They merely serve as broad guidance.

Most of the time you hear this ratio expressed in the reverse, the Put/Call Ratio. In fact, that is the way the CBOE reports it on their site. However, if you calculate the reverse - the Call/Put Ratio - a direct correlation with the Dow Jones Industrial Average is achieved. Better, with only one exception over the past four years, when this ratio gets to or exceeds the value 1.4, it is a reliable signal that the DJIA is near or at a top of some significance (a bifurcation spot where an accelerated break down is imminent). Conversely, whenever - without exception (nice) - this ratio fell to the 1.0 area or slightly below, it marked a significant bottom. In some instances there was a short (less than a month) time lag between the Call/Put Ratio signal and the key directional reversal. In other cases the reversal was contemporaneous.
This ratio is a contrarian's sentiment gage. There tends to be an inordinate quantity of call options written and purchased when markets reach tops and there tends to be an equal number of put contracts written and purchased when markets reach bottoms. This helps explain how options writers make money. But Lord help them if an upside reversal doesn't occur when this ratio falls below 1.0. A writer can cover their calls, but not their puts. Writers of naked puts - no offsetting position - have unlimited risk.
The ratios 1.0 and 1.4 are relative only for the Bear Market since 2000. Prior to then, Bullish sentiment was so high that these key reversal points were different. So they are somewhat fluid over the long run and require occasional modification. Still, over the short and intermediate-term for this ongoing Bear Market, these key ratio levels seem quite reliable. Take note that the ratio was 1.31 on 8/4/04, nearing the key reversal topping indicator of 1.4. In hindsight, we see a top was at hand.

Trannies derailed this week, crash-landing from where the air is thin, trucking south in a hurry.
In the Mid-week issue June 30, 2004, no. 62, a Parabolic Spike price pattern was identified and we noted, "Parabolic ascension does not lend itself to moderate declines or soft landings. These sorts of vertical tops lead to crashes - vertical declines. Worse, the crash occurs within a very short time duration from when the vertical rise is recognized." Five weeks later, the crash is well underway.
Prices confirmed the developing Head & Shoulders Top formation we mentioned this past Wednesday, blasting below the neckline today with the 17th largest daily price decline in five years - more than 1250 trading days - 88.75 points. Volume was up on declining days, surpassing volume during the end-of-July rally. The Moving Average Convergence Divergence momentum indicator has broken down hard. The Relative Strength Indicator is nearing oversold levels on the daily charts, but on the intermediate weekly charts is only at the 50 level - plenty of room for more decline.
We can measure a minimum downside target for Trannies by taking the distance from the neckline to the Head and subtracting that from the neckline. That gets us a target of 2788. That's just a minimum.

The NASDAQ 100 Exchange Traded Fund, QQQs, closed down, about half way between the day's highs and lows. Like so many charts right now, we see a Bearish Rounded Top pattern and a Bearish Head & Shoulders Top. The Head & Shoulders Top has a minimum downside price target of 29. The Rounded Bearish Top shows prices about to hit this pattern's sweet spot, from due east to due south (picture a globe).
Volume has been dramatically higher on down days than up. The MACD just dropped below zero again where it can stay awhile. It is breaking down hard. The only possible salve for this pattern is the RSI is getting a bit long in the tooth. In the past, when the RSI hit this level, prices rebounded. But this is a stock market crash and prices can reach an RSI far below its current 29.1. Below 10 is a more likely spot before a sustained rally emerges.
The 50 Day Moving Average just fell below the 200 day MA, and prices have broken decisively below both. The 200 Day MA is a huge psychological barrier - support on the downside, resistance once below.
DOW INDUSTRIAL'S COMPONENT CATERPILLAR HAS CRASHED!!!!
Here's a sad tribute to our nation's manufacturing industry. Dow component Caterpillar (CAT) is down 15.45, or 18.0 percent since February of this year. Worse, this stock is down 14.51, or 17.1 percent since the end of April 2004. Worse, it is down 9 points, 11.5 percent, over the past three weeks. Caterpillar has crashed.
Here's the scary part. The carnage is only about half over. The chart above shows a Bearish Head & Shoulders Top pattern - confirmed by the recent decline which has broken decisively below the neckline. The minimum downside target is 58. The RSI is near oversold levels but can go lower. The MACD looks like it wants to break lower from an already oversold area.
The daily chart on Friday, August 6th, looks like another mini-Head & Shoulders Top pattern, meaning another big move down could occur on either Monday or Tuesday. No guarantees of course. So what do you think the Master Planner's solution will be, toss CAT from the Dow 30 and replace it with something else? And what would that be? Cash?
OIL - LIGHT CRUDE - HOW HIGH IS UP?
Analyzing this chart may be a waste of time because there are so many uncontrollable factors at play here. Manipulation of Supply and Demand. Does a major government decide to stockpile reserves, thus throwing gasoline and a torch at Demand? Does OPEC decide to play coy with supply? Will terrorists blow up Saudi Arabian oil fields - or maneuver us to do it for them? Will Russia nationalize its oil industry? Will the Master Planners turn their heads as a phony oil crisis artificially drives prices higher while Big Oil Corporations book extraordinary profits? Will an ice age develop over the next year?
Well here goes. Oil sits at the top of a long-term rising trend-channel. It consistently bounces from the bottom to the top so you'd think it is time to decline. However, it also is hiking a steady climb up a narrow rising trend-channel (red parallel lines) that could lead it to an upside breakout and vertical sloping ascension - perhaps parabolic. You could draw lines (orange) to picture a Rising Bearish Wedge - typically a termination pattern - however, there are not enough touches of the converging lines at its base to qualify as textbook. The MACD looks tired, but then again, it looked tired back at $41 a barrel. The RSI is not at overbought levels yet.
You don't see this happen often, but a Bearish Head & Shoulders pattern failed back in April - June 2004. Oil seems to want to go higher.
The Economy:
Let's try the positives first. The Commerce Department reported that June's Factory Orders rose 0.7 percent and, lo and behold, May's decline of 0.3 percent was, gosh, golly, actually uh, up 0.4 percent. How 'bout that. The Institute for Supply Management's Services Index rose to 64.8 in July from 61.5 in June according to Briefing.com. Readings over 50 indicate expansion. However, the employment component declined 7.4 to 50.
Now reality. The week started off with Homeland Security Czar Tom Ridge warning New York City and Washington DC to batten down the hatches. A controversy over the relevance of the source immediately calmed Wall Street for the first half of the week.
Then the price of oil took off and all damnation broke loose. Oil busted up over $44 per barrel, the highest price ever. $50 dollar oil will kill this economy. Wall Street knows that. OPEC president Yusgiantoro lifted his arms, shrugged his shoulders and as reported by Reuters said, "It's crazy. There is no additional supply." Sorry folks. That's all there is. Isn't it interesting that 1900 years ago, before the combustion engine was invented, the Apostle John wrote in Revelation 6:6 that in the future oil would be a precious commodity. Quite the economist the old man was. CNNmoney.com reported a Reuters story on Wednesday that Russian major oil firm Yukos nears bankruptcy. The question arises, will Russia abandon free market economics and take over its oil companies? We also learned of a Texas based refinery fire. Oil is price inelastic. Folks need to have it. While deflation hits nearly every market, oil can continue to rise because people will pay whatever they have to for this lifestyle-and-life-preserving commodity. Supply will determine price.
The Mortgage Bankers Association reported that Mortgage Applications fell 0.2 percent the week ended July 30th.
The Commerce Department reported that Consumer Spending fell 0.7 percent in June. They also reported wages were under pressure, rising 0.1 percent in June, the lowest level since December.
The Jobs Number. Shocked the stocks off investors on Friday. The Labor Department reported that only 32,000 non-farm payroll jobs were created in July. The markets were used to hearing 200,000 to 300,000 new jobs each month for the past several months. We knew they were bogus numbers, seasonal and temporary low-paying, under-employment, estimate-enhanced figures. The quality of jobs being created over the past several months were not the kind one could support a family on. Quite a dichotomy. Every retail establishment you go to needs help. Six-bucks-an-hour help. People won't do that. They need career positions after graduating from college, after losing their business. They need high five-figure and low six-figure jobs to support their families after being outsourced or displaced by their merged-out-of-existence or reengineered firm. No, what surprises me is that Labor would report such a low number when the integrity of the figures didn't seem to be an issue the past several months. So what's up with this number? Or is this the souped-up version of something even more horrific? What, you say the numbers were accurate the past several months? Well, we learned today that June's originally reported 112,000 jobs was actually, uh, only 78,000. So what happened to the other 43 percent of new jobs? CNN/Money reported that the Chicago-based Challenger, Gray & Christmas counted 69,572 job cuts were announced by U.S. businesses in July. Apparently investors have had enough.
Money Supply, the Dollar and Gold:
M-3 rose $12.0 billion for the week of July 26th according to the Federal Reserve. Since May 17th, M-3 growth has been essentially flat, up $15.1 billion over ten weeks, an annualized rate of increase of less than 1 percent. Our research indicates that whenever M-3 plateaus or declines over a two month period, equities decline. Thus the current rate of growth of M-3 supports our intermediate-term forecast for an equity decline.
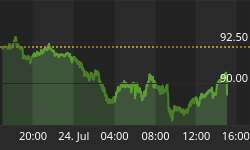
The U.S. Dollar is at a crossroads. Should it rise from here, above 90, it will have busted up through the upper boundary line of its long-term downward sloping trend-channel. A decisive break above 92 would negate the Bearish Head & Shoulders Top that is forming. That's the Bullish case. Not there yet. The Bearish case is that prices are at formidable resistance, the top of the trend-channel, with a likely pounce down from here. Should prices break below 87, the Head & Shoulders intermediateterm pattern would be confirmed and a move down into the low 80s would be highly probable. Supporting this view is a stalling MACD and an RSI reading that is close to what we've seen at prior tops.
The charts on the next page (courtesy of www.stockcharts.com) show Gold the metal and the Gold Bugs index ($HUI). Gold is hanging in there by its fingernails, still inside its long-term rising trend-channel. It looks to be completing a Bearish Head & Shoulders Top. A break below 375 confirms this pattern. The right shoulder forming for this pattern appears to itself be a completing Bearish Head & Shoulders. A break below 385 will confirm this and portend a break below 375 that portends a minimum downside break to perhaps 325. To escape from the tangled web, Gold needs to get some legs. A break above 425 negates the Double Top, the Head & Shoulders Top, and is Bullish.


The positive for the Gold Bugs index ($HUI) is that it has acted inversely to all the other major averages the past two days. That is a departure from the past year. The chart is clearly Bearish showing a huge Rounded Top and a completing Head & Shoulders Top formation in the MACD. The last time the MACD formed a Head & Shoulders Top, the $HUI plummeted. A break below minus 5 will confirm the MACD H&S pattern. The Elliott Wave count also is calling for more decline, probably into the 150 area or slightly below. The RSI is neutral and will accommodate any significant directional price action.
Bonds & Interest rates:
The Fed finds itself backed into a corner. Next week it must decide whether it raises short-term interest rates or not. They've been campaigning that the economic recovery is strong, even raised short rates six weeks ago. But Labor threw a wrench into the Master Planner's scheme and now the Fed must either admit this recovery really stinks by passing on any rate increase, or it must save face by putting the fragile economy at peril and bumping another quarter. Either way, it is hard to imagine the markets being happy.
The above chart of the 30 Year U.S. Treasury Bond shows a massive, I mean humongous, Head & Shoulders Top. The draconian beast bears sweeping left and right shoulders - double-boned formations with proportional rising and declining slopes (magenta arrows). Looks like over the next three weeks, as stocks swim with the fishes, the right shoulder will complete, probably around 112.50, the 78.6 percent retrace of the move down from April to May 2004. Then a long descent south.
Bottom Line:
A stock market crash is well underway. Since our major Fibonacci turn date on June 23, 2004, the DJIA has lost 575 points. We are in the middle stage of minute wave 3 of minor wave 1 of primary degree 3 that should last until our next key Fibonacci turn date, September 7th, 2004 or thereabouts. The technology stocks have led the way down, with the Semiconductor index ($SOX) off seven percent - just this week. Bearish Topping patterns are almost universal. While it may seem that the worst should be over, it is not. The SPX to VIX ratio has not fallen below 35.00, is only at 54.96 as of Friday, so it tells us we are nowhere near a bottom. The 10 Day Average Call/Put ratio sits at 1.28 as of Friday, August 6th. A buy signal will not trigger until this ratio approaches 1.00. New 52 week lows are a long way from indicating a turnaround upside is nigh. There may be some rallies along the way, but last week's aborted move up is a bad sign. Defense is warranted.
"Cast your burden upon the Lord, and He will sustain you;
He will never allow the righteous to be shaken."
Psalm 55:22
Announcement: There will be no Mid-week Market Update next week. The next Mid-week issue will be August 18th, 2004. The next Weekend Report will be August 15th, 2004.
Special Note: Be sure to register under the subscribers' section at www.technicalindicatorindex.com for e-mail notifications and password access of our new mid-week market analysis, usually available on either Tuesdays or Wednesdays. These midweek updates are only available via password access when posted on the web..
| Key Economic Statistics | ||||||||
| Date | VIX | Mar. U.S. $ | Euro | CRB | Gold | Silver | Crude Oil | 1 Week Avg. M-3 |
| 3/05/04 | 14.52 | 88.75 | 123.28 | 274.00 | 401.6 | 6.99 | 37.26 | 8974.1 b |
| 3/12/04 | 18.21 | 89.60 | 121.80 | 272.00 | 395.6 | 7.06 | 36.19 | 8964.0 b |
| 3/19/04 | 19.15 | 88.56 | 122.47 | 280.20 | 412.7 | 7.56 | 37.62 | 9005.8 b |
| 3/26/04 | 17.12 | 89.30 | 120.90 | 278.25 | 422.3 | 7.71 | 35.73 | 9015.3 b |
| 4/02/04 | 15.81 | 88.80 | 121.12 | 280.00 | 421.1 | 8.15 | 34.39 | 9071.5 b |
| 4/08/04 | 16.38 | 89.82 | 120.56 | 284.00 | 419.9 | 8.09 | 37.14 | 9060.6 b |
| 4/16/04 | 15.00 | 90.18 | 119.50 | 276.75 | 401.6 | 7.14 | 37.74 | 9115.2 b |
| 4/23/04 | 14.01 | 91.34 | 118.18 | 267.50 | 395.7 | 6.16 | 36.46 | 9122.6 b |
| 4/30/04 | 16.69 | 90.76 | 119.70 | 270.75 | 387.5 | 6.07 | 37.38 | 9171.5 b |
| 5/07/04 | 18.13 | 91.30 | 118.83 | 270.40 | 379.1 | 5.58 | 39.93 | 9226.9 b |
| 5/14/04 | 18.47 | 91.81 | 118.69 | 267.00 | 377.1 | 5.72 | 41.38 | 9229.2 b |
| 5/21/04 | 18.44 | 90.53 | 120.05 | 268.75 | 384.9 | 5.87 | 39.93 | 9276.4 b |
| 5/28/04 | 15.52 | 88.98 | 122.10 | 276.25 | 394.0 | 6.11 | 39.88 | 9250.8 b |
| 6/04/04 | 16.57 | 88.50 | 122.93 | 274.75 | 391.7 | 5.81 | 38.49 | 9253.4 b |
| 6/11/04 | 15.10 | 89.23 | 121.01 | 269.25 | 386.6 | 5.78 | 38.45 | 9262.8 b |
| 6/18/04 | 14.95 | 89.41 | 121.17 | 267.75 | 395.7 | 5.98 | 39.00 | 9300.7 b |
| 6/25/04 | 15.19 | 89.22 | 121.41 | 270.75 | 403.2 | 6.12 | 37.55 | 9288.8 b |
| 7/02/04 | 15.15 | 88.18 | 123.09 | 265.50 | 398.7 | 6.01 | 38.39 | 9318.0 b |
| 7/09/04 | 15.78 | 87.41 | 124.10 | 269.00 | 407.0 | 6.46 | 39.96 | 9262.4 b |
| 7/16/04 | 14.43 | 87.12 | 124.36 | 271.50 | 406.8 | 6.72 | 41.25 | 9257.3 b |
| 7/23/04 | 16.50 | 89.23 | 120.88 | 269.50 | 390.5 | 6.33 | 41.71 | 9279.5 b |
| 7/30/04 | 15.27 | 90.12 | 120.10 | 267.00 | 391.7 | 6.56 | 43.80 | 9291.5 b |
| 8/04/04 | 19.34 | 88.45 | 122.69 | 268.25 | 399.8 | 6.77 | 43.95 | - |
Note: VIX turns scared, Dollar falls, Oil is up.


