


By the Law of Periodical Repetition, everything which has happened once must happen again, and again, and again -- and not capriciously, but at regular periods, and each thing in its own period, not another's, and each obeying its own law ... The same Nature which delights in periodical repetition in the sky is the Nature which orders the affairs of the earth. Let us not underrate the value of that hint." -- Mark Twain
A Review of the Past Week
The rally completed its up phase on Monday, and selling resumed bringing prices to new short term lows by the end of the week.
After the close on Monday, I wrote the following "Closing Comment" which was emailed to the readers on our market signals list:
Applying black and white standards to the stock market is often inadequate. We are in such a situation right now.
In this week's newsletter I stated that a "Confirmed Buy" would be issued if we broke out of the down channel.
Well, today we did just that, but THE WAY we broke out leaves much to be desired. It is neither confirmed by the volume nor by
the A/D. And it pushed the short term indicators right back into overbought territory. Structurally, this could be a wave 5 of the move that began at 1080. Furthermore, the QQQ failed to confirm the break out!
There was a P/F phase count to 1109, which was nearly met today.
Put all of the above together and you get a red flag short-short term.
Market action will need to improve tomorrow if we are to go up to our 1019 target before further consolidation or retracement
takes place.
Further updates suggested that the renewed weakness that began on Monday was likely to be the bottoming action of the current short term down trend (brought about by the half-span of the 9-month cycle), with a new projection to the 1065 level.
After reviewing the action of the market for the week, It looks as if this was indeed the climactic terminal phase of the move which started on 6/24. Both the SPX and the QQQ have reached their projections, and the final phase structure appears to be complete. This should lead to a rally beginning on Monday.
I will give the criteria needed for a confirmed short term buy a little later on.
Current Position of the Market.
Intermediate trend:
SPX - Sell. A confirmed sell was given on 3/10 and re-confirmed after prices failed to penetrate the former highs.
Short term trend:
SPX - Preliminary buy signal.
Note: If you would like to receive an explanation of how I arrive at these signals and be notified on the day that they occur, please let me know at andre@marketurningpoints.com The explanation has been enhanced by the outlining of a strategy based on these signals. Once on the list, you will also receive periodical "Closing Comments",
CYCLES: As you know, I do not believe that significant market moves occur independently from cycles. So what cycle is it that caused last week's decline? I believe that it was probably the bottoming action of the 9-month cycle half-span.
The 9-month is one of the most influential intermediate term cycles. It is usually confused with the 40-week cycle, but these are two separate entities which make their lows about 10 to 12 weeks apart. The 40-week cycle is a subdivision of the 120-week cycle, just as the 40-year cycle is a subdivision of the 120-year cycle. These are rooted in the number 360, which has so many applications in the time/space dimensions of our solar system.
A chart of the 9-month cycle appears below. You will notice that its periodicity normally varies from 38 to 44 weeks. Like most long term cycles, the majority of the time the 9-month cycle has a half-span dip. As you can see on the chart, the dip -- shown in dotted lines -- occurs in every instance except one when the top of the cycle apparently came exactly in the middle of its span.
Even more relevant for today, is that in each instance the dip is followed by a good rally which varies according to the existing cyclic configuration.
This dip ranges from 18 to 22 weeks from the 9-month low and may or may not happen together with other cycles Since it has been 19 weeks from the last low, this was when we should have been expecting some price weakness. I had thought that the low might have been made in conjunction with the recent cluster of short term cycles, but this week's market action suggests otherwise.

What's next?
By the end of the day on Friday, the QQQ had completed a 5-wave pattern from Monday's high and the SPX a 3-wave zig-zag . Since both indexes have reached their downward projection from the recent highs, a reversal is likely to take place on Monday. This week's price action looks very climactic and a powerful rally could develop immediately without requiring a basing pattern.
Adding credibility to this scenario is the fact that the NYSE A/D refused to support the price weakness all throughout Friday's decline.
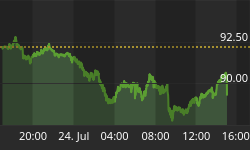
For a "Confirmed buy" signal to be given, prices must move immediately above 1075 on positive A/D of 1800 or more on an hourly basis, and follow through by exceeding 1090 on continued good breadth. The new highs/new lows will have to confirm with at least 100+ within 2 or 3 days, and we will need to see better volume than that of recent days.
The 30-minute chart of the SPX which appears below will illustrate the significance of the price levels mentioned.

SUMMARY: The down trend is likely to have ended on Friday with a selling climax caused by the bottoming of the 9-month cycle half-phase. This will be born out by a rally beginning on Monday with good breadth and volume.
It is also significant that this move is completing a 5-wave structure which began in March.
A completed 5-wave pattern invariably marks the end of a trend and brings about a reversal of prices. However, this is not expected to lead to new highs for the long term move.
The intermediate term trend remains a "Sell" which is expected to continue into September/October.


