


"October: This is one of the peculiarly dangerous months to speculate in stocks. The others are July, January, September, April, November, May, March, June, December, August and February." ~ Mark Twain
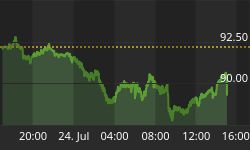
Prices for the major markets moved higher last week although the fighting with major levels continued.
The Dow Jones pretty much finished flat however the index managed to close above 11,000 for the second week. The real action on Friday was in the currency markets as the Euro & the Sterling made new highs in the recent up moves against the dollar. However the noteworthy fact was that the Euro closed below the major level of 140 for the week and the Sterling closed below 160.
Overall as the dollar weakness continued are we topping in the major markets or simply gathering ammunition for the next surge up?
We start with the Euro...
The move from near 11800 has seen the currency rise to Fridays high of 14159. However the real recent surge has been sparked from 12600. We have been surprised with the sheer ferociousness of the move as we imagined prices would fly to 130+ but 140+ can mean any one of two things;
Firstly we head to the 2010 highs of 145+, 2009 highs of 151+ or simply the all time highs of 160 of which we can see neither of them occurring...
Secondly we're simply putting in a top in which prices will fall at the same pace of this current rise if not faster...
We start off with this four hour Euro Chart

As you can see the Euro made a new recent high on Friday in which it fell back and closed the week below 140. The topping pattern could well be right underway and that is why Friday's session could well be more significant than many may view to be.
The following chart highlights Friday's action in line with the toppings

The chart above shows the green trend line which can be seen on both charts. This trend line practically maps out the entire up move from the 126 region. Friday's action has left the price just hovering above this trend line in which a snap could well be detrimental for this move.
TMS is watching the above red triangle that has been mapped out in which we will soon find out if price is topping out in relation to Friday's action. We wouldn't like to see price move above the base of this triangle however given the brutality of this up move it would be likely to expect bounces after declines. In which case a classic move would be to hit the intersecting blue trend line in which price could rise to make a one touch but roll down significantly thereafter.
The opening few sessions for this week will be pivotal and like previous weeks the closing days of the week may not produce bounces after declines.
Why is TMS favouring downside to re-emerge soon?
Yes it is spot on that TMS expected prices to rally when all were too busy calling for price to equate 1:1 with the dollar. Yes we stated prices would continue rising when we witnessed the boring sideways action of mid August to mid September. Yes TMS mapped out charts which showed the Euro would move 135 in line with the current timeframe when prices were putting in the lows of 120's. No TMS did not expect the Euro fierceness to take prices to 140's but what do you expect when the declining prices of the Euro had a record sized short attached to it?
Is this real Euro Strength or dollar weakness? Is this real dollar weakness or simple manipulation?
Either way we see this as a dead cat bounce in which the real issues will ascertain the direction of prices once the technical games are understood.
We view the current rise similar to a steep rise in prices that occurred in late 2008.
Chart showing the similarities of up move in 2008 with 2010

At this moment in time the new trading week will need to look up at last week's highs while prices will need to continue sliding from Friday's action.
Dollar strength will no doubt also send the Sterling lower in which we would view current price action as top making. The Sterling's recent upward action has not been as powerful as the Euro's and it would seem that this currency will lead the way down.
Dow Jones MAJOR TOP
All this excitement about current price rises brings out the contrarian in TMS. We simply ask you this - How does the crash talk dissolve in bull mania?
When prices are declining, the media, the pundits and the novices talk about crashes and when prices rise of course it's all about the Bull. At TMS we have nailed the Dow Jones time and time again this year and here is what we have to say:
Weekly Dow Jones Chart

It is in our experience to acknowledge this current upward action with some realism. This reality check states simply two things.
Firstly - We're at the top of the range for the price action of 2010
Secondly - We're topping with a chance of a new 'fractional' high for 2010 in which the majority get hit with the excitement and then get hit with the declining action that will soon follow.
The yellow line has been a key pivot this year in which 10660 has not only be problematic for the market but is also near to the opening mark for 2010. The major mark is shown with the red line in which you can clearly see prices sitting under. The question is will the madness lead to a marginal new high for the year in which a hit of the substantial blue line is provided? This is what the market will decide and this is why the new week of trading will be absolutely imperative for the global markets to perhaps deliver a change in dollar direction.
For the first time ever TMS has made a 6 month subscription package available to our global audience in which an exclusive rate has been issued for a limited time only. All our annual subscription packages were snapped up immediately and unfortunately will not be offered again until some point in 2011. Having been bombarded with requests to bring back a package rate we have decided to tailor a 6 month package for new clients whilst also giving a chance for our current monthly subscribers to join us at a rate in which the availability will soon finish - TMS will only allow for the availability of 100 places. TradingMarketSignals.com 6 Month - Exclusive


