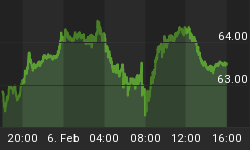
After consolidating for four sessions right around its August 2009-October 2010 down trendline, today the Shanghai Composite Index accelerated to the upside to 3,051 in what looks like the start of a new upleg that could be heading for a test of its April high at 3182, or another +4.3%.
Meanwhile, the SPX hit a new post- July high today at 1196, possibly on the way to a test of its Apr. high, up 2.5% from current levels. At this juncture, only a decline that breaks 2,950 will argue that the Sept. 20th upleg in the Shanghai is complete. Finally, let's also notice that RSI for neither index has confirmed today's new highs, which is a warning signal that the Jul-Oct upmove likely is getting a bit long-winded.
Strength in the Shanghai index should continue to benefit names likes Arch Coal (ACI), Walter Energy (WLT), and Freeport-McMoRan Copper & Gold (FCX). See chart below.
Looking at the chart on ACI, my near-term pattern work indicates that all of the action (weakness) since the early Oct high at 27.31/37 has the right look of a completed or nearly completed correction within the larger July-Oct advance. For the past three sessions, ACI has found support along the rising 50 DMA, now at 24.92, with the slightly rising 200 DMA now at 23.81. The entire upmove from 19.09 to 27.37 is part of a larger, high-level consolidation period that started back at the Jan. high of 28.34, and which when complete, should provide the launchpad for a powerful new upleg 30.50, and then perhaps 34.00-35.00 thereafter.
Such an outcome could be closely tied to the Chinese economy and the need for procurement of coal and other mining and building materials. For now, with the Shanghai Composite in a very strong technical position, we want to remain long ACI in our model portfolio unless and until it breaks and closes beneath its 200 DMA.


