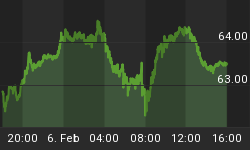
With little on the calendar for today, trading started out sluggishly but began to get more interesting as the day wore on. I am writing this comment earlier-than-usual today, because I am leaving soon to head to NYC and attend a very exciting meeting of the QWAFAFEW Quantitative Investment Society. The topic is "Chasing Bernie Madoff," and the speakers are Harry Markopolos, Erin Arvedlund, Frank Casey, and Michael Ocrant. You will recognize these names if you read the excellent book No One Would Listen: A True Financial Thriller, which details the efforts these guys made to get the SEC to investigate Madoff - efforts which the SEC managed to ignore for a decade until Bernie basically turned himself in. It should be very exciting, but it means I won't be able to see if the present (2:00pm ET) 0.6% decline in equities (and 19/32nds decline in TYZ0) turns into a rout or instead (more likely) recovers to end the day down only a little bit. Either way, the market continues to rest uneasily in a fairly unstable equilibrium, near resistance but seemingly out-of-gas for a further rally.
Tomorrow's trading ought to be slow; the only data are the trade balance (Consensus: -$45.0bln from -$46.3bln) and an Initial Claims (Consensus: 450k from 457k) figure that was pushed to Wednesday due to the Veterans' Day holiday on Thursday. I would think that 'Claims has some chance of exceeding expectations, since the earlier release may make it more difficult for all states to get their data in on time - and we have seen recently that when this happens, the BLS estimates tend to be mildly optimistic. (It isn't an important enough report or likely to be an important enough difference that I would put any money on that supposition, but just be aware when the number is released that you need to ask "how many states didn't report on time?").
I need to make a quick note about yesterday's comment. A reader who was confused (misled??) by my chart suggested that since the decline in the M2/M0 ratio wasn't associated with deflation, the rise in the ratio may not be associated with inflation. I realized upon reading that remark that I probably should have shown a different chart because focusing on the ratio can be confusing. The point is not the level of the ratio, but rather the change in the level of M2 - that is what causes inflation. The ratio itself fell because the level of M2 didn't change much when M0 ballooned, but that was (I think) because of IOER and perhaps other factors as well. The ratio fell, in short, because the denominator exploded. So, if the ratio goes back to its former level because the denominator (M0) collapses but the numerator (M2) is unchanged, that's okay. But if it goes back to its former level because M2 explodes, that's highly inflationary. So it isn't the ratio you want to look at, it's the level (really, the change) in M2. The chart below uses the same data, but separates the components. If you compare this chart to the ratio chart, it's plain to see that it is the rise in the monetary base that drove the ratio lower. The question isn't really whether the ratio moves, but whether M2 "catches up" or M0 declines back to its old levels. My math yesterday was meant to illustrate what M2 catching up would imply. To repeat yesterday's caveat: I have no idea what will happen, and the point is, neither does the Fed...but the range of potential outcomes is large.

Splitting the ratio into its component parts makes my point clearer.
Thanks to the reader for pointing out this confusion.
.
A brief aside here on some other work I've been doing that may be of interest to readers, retail investors, or their advisors. I have written a paper called "Maximizing Personal Surplus: Liability-Driven Investment for Individuals" that is available at SSRN (here). Here is the abstract:
To date, the financial literature has focused on very simple algorithms designed to improve the solution to the two-part challenge of determining the optimal portfolio asset allocation strategy and determining the maximum sustainable withdrawal rate for retirees. Most research, for example the well-known "Trinity Study" of Cooley, Hubbard, and Walz, pursues the asset-allocation problem by maximizing long-run asset growth subject to a withdrawal rule and a given acceptable probability of remorse (a.k.a. shortfall). However, the Liability-Driven Investing (LDI) thought process improves the approach by seeking instead to maximize return for a given level of volatility of the portfolio surplus, rather than optimizing on the basis of the volatility the assets themselves; by more closely matching assets and liabilities, the sensitivity of the strategy to unexpected returns, risks, and correlations is greatly decreased. I update the Trinity Study to incorporate inflation-indexed bonds and then illustrate how the LDI thought process may be applied to individual investors.
One of the important things I do in the paper (at least, I think it is important) is to update a table that appeared in the original Trinity Study showing "portfolio success rates" for various combinations of stocks and bonds. When the original study came out, inflation-linked bonds were just getting started, so this important asset class wasn't included. The analogous chart, based on Monte Carlo simulation (see the paper for more details) and including TIPS, is below.

Updated Trinity Survey chart
If this interests you, take a look at the paper. I also illustrate how the "portfolio success rate" doesn't necessarily tell the full story; you also care how long it takes, if the portfolio fails, for that failure to happen. Is it one year or 20? It makes a difference in planning. Moreover, the structure of your own "liabilities" matters in terms of finding the right allocation for you. If you're interested, and read the paper, I am always interested in feedback.


