


11/15/2010 9:15:27 AM
The markets are at a point where if they break down further, the bears gain control...
Recommendation:
Take no action.
Daily Trend Indications:

- Positions indicated as Green are Long positions and those indicated as Red are short positions.
- The State of the Market is used to determine how you should trade. A trending market can ignore support and resistance levels and maintain its direction longer than most traders think it will.
- The BIAS is used to determine how aggressive or defensive you should be with a position. If the BIAS is Bullish but the market is in a Trading state, you might enter a short trade to take advantage of a reversal off of resistance. The BIAS tells you to exit that trade on "weaker" signals than you might otherwise trade on as the market is predisposed to move in the direction of BIAS.
- At Risk is generally neutral represented by "-". When it is "Bullish" or "Bearish" it warns of a potential change in the BIAS.
- The Moving Averages are noted as they are important signposts used by the Chartists community in determining the relative health of the markets.
Current ETF positions are:
In cash.
Daily Trading Action
The major index ETFs opened significantly lower and then moved higher for the first half hour of trading then rolled over and took an express elevator down until late in the noon hour. From that point, the major indexes see-sawed higher with weakness in the final hour seen across the board but with the S&P-500 and Dow catching a bid in the final fifteen minutes. The Semiconductor Index (SOX 382.61 +0.12) defied gravity and moved slightly higher while the Russell-2000 (IWM 72.03 -1.22) sold off most of two percent. The bank indexes closed lower and entered trading states with both the Bank Index (KBE 23.35 -0.53) and the Regional Bank Index (KRE 23.34 -0.54) falling more than two percent. The 20+ Yr Bonds (TLT 95.81 -0.52) fell one half of one percent. NYSE volume was somewhat light with 965M shares traded. NASDAQ volume was average with 2.165B shares traded.
There was a single economic report of interest released:
- U of Michigan Consumer Sentiment (Nov) came in at 69.3 versus an expected 69.0
The report came out twenty-five minutes after the open and since it met expectations, it wasn't a market mover.
The U.S. dollar posted a 0.2% loss, the first in six sessions. Once again, the dollar failed to break up through resistance but the sell-off didn't ignite equity bulls.
The session began in the red due to concerns over Chinese inflation. The concern is that Beijing would raise interest rates to cool off the overheating economy and that this could slow economies around the world.
All ten economic sectors in the S&P-500 finished lower led by Materials (-2.2%), Financials (-1.5%), Tech (-1.4%) and Energy (-1.4%).and Healthcare (+0.2%) moved higher while Utilities and Consumer Staples were unchanged. That left five of ten sectors in the S&P-500 moving lower on the day led by Tech (-1.8%).
Implied volatility for the S&P-500 (VIX 20.61 +1.97) rose most of eleven percent while the implied volatility for the NASDAQ-100 (VXN 22.55 +3.18) rose more than sixteen percent!
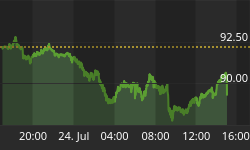
The yield for the 10-year note rose sixteen basis points to close at 2.76. The price of the near term futures contract for a barrel of crude oil fell $3.37 to close at $84.44.
Market internals were negative with decliners leading advancers nearly 5:1 on the NYSE and by greater than 4:1 on the NASDAQ. Down volume led up volume by 8:1 on the NYSE and by 4:1 on the NASDAQ. The index put/call ratio rose 0.38 to close at 1.54. The equity put/call ratio rose 0.09 to close at 0.67.
Commentary:
Friday's move lower hasn't yet broken the back of the bulls as no breach of significant support has yet been broken. However, implied volatility spiked indicating that some market participants are finally waking up from their incredible complacency of late. Before the open, we had already noted the reaction to the -5.2% drop of the Shanghai Composite due to concerns over tightening by Beijing last Friday.
We exited long term short positions as we expect the markets to move higher in the coming week before an imminent collapse after options expiration this coming Friday. We may change our short-term forecast based on trading activity seen on Monday.
We hope you have enjoyed this edition of the McMillan portfolio. You may send comments to mark@stockbarometer.com.


