


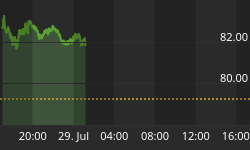


Chart 1 Pound One Hour Chart
As you can see from the chart above the price is reacting to the downward sloping channel since placing 'a high' at under 16300.
At this point in time we are hitting the upper channel marked by the red lines and as mentioned previously overhead resistance sits at 16100. This should prove to be a difficult area for the market over the short term. Ireland's bailout has all markets moving higher but we're not convinced with the upside and can't see it sticking. Notice the indicator along the bottom is getting over extended and this does favour price to start flipping back.
Chart 2 Euro Four Hour Chart
The Ireland bailout has given the Euro the limelight in relation to this news. The major attention is grabbing headlines - not just financial headlines but global main headlines. The Euro's rise is being mentioned and with this we are highly sceptical of these rises sticking looking further out. We have a strong possibility of prices diving from near to current levels. The intersecting red channel should prove difficult with the upper side of it being immense. The area also couples with our blue resistance line at 138. This number will be hard to overcome. Moving towards 137 could well kill this whole gap up that we are seeing and last week's low could well be in the equation again. IF this is not the case then we will have to evaluate the prospects of keep the Euros rally at these levels into year end. However we have high probabilities favouring a swing lower from here.
Chart 3 Dow Jones Four Hour Chart
As you can see again the prices have gapped slightly higher from Fridays close. Overhead resistance is place at 11300 and taking it out will surely take us higher. However the current empowering resistance is at the blue line. Should the market snap the lower yellow line with conviction this will confirm the resistance of the blue and we would favour lower prices with declines taking us back to last week's lows.
Chart 4 Gold Four Hour Chart
We have simple stuff going on for Gold at present. Our chart on Friday showed the resistance area as per the upward sloping red trend line. Price backed off $20 to $1340 and this low will need to be broken for further downside to really kick in. The yellow circle shows the resistance lines and we have high probabilities of price failing from here and heading south. At present we must assess the reactions of such areas during Monday's session.
Although it may not seem like it, markets are poised for reversals which would open the window of last week's lows.
Join us with our Thanks Giving Special: We're celebrating these sexy declines, perhaps you didn't have much joy with them but tradingmarketsignals.com uncovered them and with that we're giving readers the chance to join us exclusively in which we've taken $20 of our 6 month subscription ends 25th November 2010. TradingMarketSignals.com 6 Month - Exclusive


