


Summary of Index Daily Closings for Week Ending August 27, 2004
| Date | DJIA | Transports | S&P | NASDAQ | Jun 30 Yr Treas Bonds |
| Aug 23 | 10073.22 | 3068.22 | 1095.82 | 1838.53 | 110^16 |
| Aug 24 | 10098.63 | 3102.17 | 1096.19 | 1836.89 | 110^16 |
| Aug 25 | 10181.74 | 3114.00 | 1104.96 | 1860.72 | 110^26 |
| Aug 26 | 10173.41 | 3108.84 | 1105.09 | 1852.92 | 111^08 |
| Aug 27 | 10195.01 | 3108.80 | 1107.77 | 1862.09 | 111^11 |
| SHORT TERM FORECAST (Next Two Weeks) | ||||
| TREND | PROBABILITY | Legend | ||
| Substantial Rise | Low | |||
| Market Rise | Medium | Very High | 80% | |
| Sideways | Medium | High | 60% | |
| Market Decline | High | Medium | 40% | |
| Substantial Decline | Medium | Low | 20% | |
| Very Low Under | 20% | |||
| INTERMEDIATE TERM FORECAST (Next 12 Weeks) | ||||
| TREND | PROBABILITY | Substantial | 800 points+ (DJIA) | |
| Substantial Rise | Low | Market Move | 200 to 800 points (DJIA) | |
| Market Rise | Medium | Sideways | Up or Down 200 (DJIA) | |
| Sideways | Medium | |||
| Market Decline | High | |||
| Substantial Decline | High | |||
This week the Dow Jones Industrial Average closed up a modest 80.87, in line with last week's Short-term TII reading of positive 9.25. The DJIA is up 411 points since the intraday bottom on August 13th, but on anemic and ever-declining volume. NYSE volume this week: 956 million shares on August 23rd, 1.09 billion the 24th, 1.13 billion the 25th, 994 million the 26th, and a pathetic 845 million shares on the 27th. This week's daily average - 1.0 billion - is 32.2 percent below the 1.489 billion daily average for the first seven months of 2004. Not a lot of confidence in equities right now. Program trading was up to 53.2 percent of NYSE volume for the week ending August 20th versus only 35.6 percent the second week of February. Looks like the public is out and only the big boys are playing.
The volume numbers support the Bearish pattern in the Broker/Dealer Index ($XBD) which we covered in August 25th's Mid-Week Market Update (available in the archives at www.technicalindicatorindex.com). Brokers need volume - buying volume - to make money. Any sustained intermediate-trend advance will need substantially improved buying volume. The lack of buying conviction supports our belief that this is a terminal Bear Market rally, with about a week or so left, tops.
| Equities Markets Technical Indicator Index (TII) ™ | ||||
| Week Ended | Short Term Index | Intermediate Term Index | ||
| Apr 30, 2004 | (33.25) | (34.88) | Scale | |
| May 7, 2004 | (28.75) | (47.75) | ||
| May 14, 2004 | (25.75) | (66.45) | (100) to +100 | |
| May 21, 2004 | 22.00 | (67.23) | ||
| May 28, 2004 | ( 3.50) | (48.48) | (Negative) Bearish | |
| June 4, 2004 | (55.75) | (34.07) | Positive Bullish | |
| June 11, 2004 | (77.75) | (25.92) | ||
| June 18, 2004 | (40.25) | (31.17) | ||
| June 25, 2004 | (34.00) | (26.10) | ||
| July 2, 2004 | (41.50) | (27.64) | ||
| July 9, 2004 | (32.50) | (30.21) | ||
| July 16, 2004 | (33.75) | (41.99) | ||
| July 23, 2004 | (59.00) | (49.98) | ||
| July 30, 2004 | 46.25 | (52.18) | ||
| Aug 6, 2004 | (38.00) | (50.40) | ||
| Aug 13, 2004 | (15.75) | (49.03) | ||
| Aug 20, 2004 | 9.25 | (43.82) | ||
| Aug 27, 2004 | 9.25 | (39.81) | ||
This week the Short-term Technical Indicator Index comes in at positive 9.25, indicating a sideways to up move is probable. This indicator is a useful predictor of equity market moves over the next two weeks, both as to direction and to a lesser extent strength of move. For example, readings near zero indicate narrow sideways moves are probable. Readings closer to +/-100 indicate with a higher degree of confidence that an impulsive move up or down is likely over the short run. Market conditions can change on a dime, or the Plunge Protection Team can come in and temporarily stop market slides, so it may be unwise to trade off this weekly measured indicator.
The Intermediate-term Technical Indicator Index is useful for monitoring what's over the horizon - over the next twelve weeks. It serves as an early warning system for unforeseen trend changes of considerable magnitude. This week the Intermediate-term TII comes in at negative (39.81).
Analogs are fun because of the curious nature of their similitude and repetitive pattern in different markets and different times. The reason different markets mirror is because prices reflect the common psychology of mass human behavior. "That which has been is that which will be, and that which has been done is that which will be done" (Ecclesiastes 1:9). The first chart on the next page compares Japan's Nikkei from 1984 through 1995 with the Dow Jones Industrial Average from 1996 through 2004. Except for a parabolic spike top in the Nikkei that was not as extensive in the DJIA, the correlation is remarkable. At this stage for the Nikkei came a 31.6 percent one-year decline - straight down. Either the analog is going to break apart here or the DJIA is about to crash.
The second chart on page 3 updates key Fibonacci turn dates in the DJIA beginning 1/14/00 and projected through early 2005. Since 2000's top, every single short and intermediate-term top and bottom has occurred a Fibonacci golden ratio - phi (.618/.382) - number of trading days from 1/14/00, and also from the next sequential top or bottom. Scheduled next is a September 7th turn date. It is looking like that may be a top (+/- a day or so).


For a significant decline to occur, the 10 Day Average Call/Put Ratio - a contrary sentiment gage - should move up close to the 1.40 area. As of August 27th, this ratio sits at 1.15. However, the average for the past five days has been 1.21. If September 7th is to be a significant top, we would expect this ratio to rise next week.
The first chart on the next page maps out the Elliott Wave Intermediate-term count that we believe is most correct. Next up should be a Minute degree wave 3 down - probably running from early September into October - of minor degree 1 down of Primary degree (3) down. The fact the markets are taking their good old time rolling over warns that DJIA wave 3 down could be sharp and extensive.
The second chart for the Dow Jones Industrials (courtesy of www.stockcharts.com) shows that the rally is running out of steam, but probably has not topped yet. Markets seek order, which is why prices generally top or bottom at Fibonacci price levels or dates, or at the top or bottom of trendchannel or Bollinger Band boundaries. Perfect Order would occur with a top around September 3rd or 7th, at around 10,337. We've already explained why this date produces order. Now the price level. At 10,337, prices will hit the 78.6 percent retrace point of the decline from 10,479 on June 23rd to 9814 on August 12th, what we believe was Elliott Wave Minute degree 1 down. It has been common during this bear Market since January 2000 for wave 2's to retrace a Fibonacci .786 (square root of .618) of the preceding same degree wave 1. Also, around this 10,337 level, prices would hit the upper boundary line of both the 2 percent Bollinger Band and the downward trend-channel. The RSI is only at 58.7, and would top ideally at 70 or above. The MACD's upward momentum may be waning, but is still rising. So another 150 point rally would be neat and tidy. Now watch prices dive on Monday.


The QQQs, our proxy for the NASDAQ index, has completed a Bearish Head & Shoulders pattern that is confirmed by the decisive break below the neckline in early August. The rally going on is corrective, having retraced a Fibonacci 38.2 percent of the previous decline. Short-term, it gets interesting here as prices have bucked up against the neckline. While this could provide strong resistance, the RSI indicator is not overbought and the MACD is actually rising sharply, and looking to go above zero. Should prices decide to continue to rise, the 61.8 percent retrace level is at 35.80 - which also happens to be the 200 Day moving average. We believe there is a good chance they will get there. Volume has also been anemic in this index during the rally.
So it looks like another week or so of rally, prices moving perhaps as high as 35.80, then a strong intermediate-term decline from early September into October. The Rounded Bearish Top pattern is textbook perfect, a no-doubt-about-it pattern of distribution from smart-money to the not-so-smart. The Bearish Head & Shoulders pattern tells us the minimum downside target is 29.
Dow Component Walt Disney Co. Looks About Ready to Drop 25 Percent
Walt Disney Co. (DIS) has formed a Bearish Head & Shoulders Top pattern that was confirmed with the price break below the neckline in early August. This pattern tells us those in the know - the smart money - have been using rallies to unload the stock. The public should soon catch on and that will be the catalyst for the sharp drop. The minimum downside price target is 17.0, a 25 percent decline from Friday's close. Both the 50 Day moving average and the 200 day moving average are now pointed down.
However, before that event occurs, there is a little more rally left in this stock according to the MACD which is rising hard, and the RSI, which is not yet at overbought levels.
The Economy:
Durable Goods Orders rose 1.7 percent in July, reversing the declines seen the past several months according to the Commerce Department. The boost came from passenger aircraft. Take transportation out and Durable Goods Orders were up a minuscule 0.1 percent. The Fed reported that Capacity Utilization was also up, operating at 76.3 percent in July, the best in three years.
The Commerce Department revised 2nd quarter GDP down to 2.8 percent from a previously reported 3.0 percent. Don't you just love the M.O. for this administration. Spin, spin, spin. Repeatedly we see bogus optimistic numbers reported only to be revised lower later when nobody really cares. This adds a new dimension to the Fundamental Analysis approach to investing versus the Technical Analysis approach. Fundamental Analysis essentially says invest based upon the news, the economic statistics, and forecasts of such, since they drive corporate earnings, and corporate earnings drive stock prices. Well, not only do we TA folks believe that approach is false, but even if there was an ounce of truth to it, you can't get honest numbers anymore. By the way, if anyone wants to argue that corporate earnings drive stock prices, please read John Mauldin's excellent book, Bull's Eye Investing. Returns on stocks are far more a function of dividends and price/earnings multiples people are willing to pay than the actual earnings themselves.
Real Estate is on the ropes. Will it go down for the ten count? Mortgage Applications fell 6.3 percent for the week ended August 20th according to the Mortgage Bankers Association. Existing Home Sales fell 2.9 percent in July according to the National Association of Realtors. New Home Sales fell a whopping 6.4 percent in July according to the Commerce Department. Inventories of unsold homes rose to 4.2 months, the highest level in a year and a half.
The most powerful financial human being on earth urged less compassion for tomorrow's aged by cutting back on social security benefits. He urged Dubya to raise the ages when retirement benefits are paid and alter the mechanism of increasing benefits for inflation. Gee, what's next, Al, euthanasia?
We learned this week of two Russian planes going down within minutes of each other. We await confirmation that terrorists were involved. When do you figure that report will come out? November 1st? While we're on the subject of politics, Mark Gongloff, CNN/Money senior writer, pointed out on www.cnnmoney.com Monday that every time an incumbent president lost the election, it was because of poor stock market performance "either in the four years leading up to the election or in the last year before the election, according to recent research by Ken Tower, chief market strategist at CyberTrader, a unit of Charles Schwab (SCH: Research, Estimates)." You want scary? The Master Planners know this.
The Census Bureau reported that an additional 1.3 million people fell to the poverty level, and that 12.5 percent of Americans are living in poverty, the highest level in ten years. 35.9 million good folks are now categorized as "poor." The report reflects changes since 2002. The Census Bureau also reported that 45 million U.S. residents, 15.6 percent, do not have health insurance, an increase of 1.4 million since 2002. That's the highest percent of the population uninsured since 1998 according to Julie Appleby, USA Today August 27th, 2004 (USATODAY.com). It is not just the poor. Twenty-seven percent of self-employed workers are going without health insurance. I wonder how many of the impoverished are displaced workers. So much for Dubya's "compassionate conservatism."
The Labor Department reported on Thursday that Initial Jobless Claims rose to 343,000 the week ended August 21st. The total number of unemployed people collecting benefits was 2.897 million for the latest reporting week. That does not include folks who are out of work but have used up their unemployment benefits.
And of course an anesthetized citizenry shrugged off all of the above as the University of Michigan's Consumer Sentiment reading was revised for August from 94.0 to 95.9. This indicator appears to be following equities' performance for the moment. Lethargy in consumer confidence was confirmed by the ABC/Money magazine consumer comfort index reading for the week ended August 22nd.
Money Supply, the Dollar, & Gold:
There has essentially been no change in M-3 over the past 13 weeks. This zero percent annualized growth rate no doubt has helped buoy the U.S. Dollar. Our research has found that whenever M-3 rises, equities rise, and whenever M-3 plateaus or falls, equities decline. M-3's zero percent rate of change over the past three months supports our view that a significant equity slide is forthcoming.
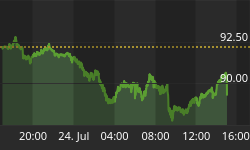
The U.S. Dollar sits at the top of its long-term declining trend-channel. It has also formed the makings of a textbook Head & Shoulders top. To complete the H&S pattern, prices must break below 87. Should they do so, the minimum downside target is 82. Should prices break decisively above 90, the long-term down-trend will be broken, and the forecast for the Dollar will be up. Which way will it go? Well, the RSI is nearing a top and the MACD is rising, but its rise is slowing. That suggests down.


Gold still sports a Bearish Double Top formation, raising the caution flag. Prices remain safely inside their long-term rising trend-channel, closing within 5 points of the convergence of their 50 Day and 200 Day moving averages. The RSI sits in neutral territory while the MACD looks ready to turn down. A decline below 385 is Bearish and a breakout above 435 is Bullish. Gold seems to have followed Oil lower this week, down 10 points. A break below 375 confirms a Bearish Head & Shoulders top that would portend Gold prices below 325. That would be a terrific accumulation opportunity.
The Gold Bugs Index's ($HUI) recent ascent was repelled at the 200 Day moving average which also happened to be the 61.8 percent retrace of the move down from April to May 2004. That is a likely indication that corrective wave 4 up completed there and wave 5 down is underway, taking prices below 150. The RSI has started its decline from overbought territory and the MACD's rise is losing steam fast.
The 30 Year U.S. Treasury Bond's MACD and the RSI look like they have topped and that wave 3 down of (3) down is now underway - or soon will be. The .786 retrace level of wave 1 down of (3) down is at 112.50, so one more thrust up would get us there. There is a massive Head & Shoulders Bearish pattern that has formed, just waiting for a break below 102.50 to confirm with a minimum downside target of 85.00.
If equities are about to decline in earnest, how could Treasuries accompany them? Wouldn't a flight to quality rally Bonds? Maybe. However, should the Fed respond to an equity event with massive infusions of fiat paper, the U.S. Dollar would likely take a hit and Bonds would follow.

Japan's Stock Market is Set Up to Crash!
Once the current rally completes, the Tokyo Nikkei Average ($NIKK) will be set up for a major drop - a crash - that takes prices to at least 8,830, a 21 percent decline. A break below the Head & Shoulders neckline - below 10,600 - will confirm the pattern. As long as prices remain above 10,600, the H&S pattern is not complete. But should they break that level, gang way below.
Until then, the MACD is rising sharply and the RSI is not overbought. That likely portends more upside before the reversal. But this intermediate-term pattern is textbook. It is a massive top.
Bottom Line: The SPX/VIX Ratio is back into Crash territory, over 75. Equities should rally into late next week, then a precipitous decline should occur throughout September and perhaps into October. Caution is warranted.
"But we do not want you to be uninformed, brethren,
about those who are asleep, that you may not grieve,
as do the rest who have no hope
For if we believe that Jesus died and rose again, even so
God will bring with Him those who have fallen asleep in Jesus.
For this we say to you by the word of the Lord, that
we who are alive, and remain until the coming of the Lord,
shall not precede those who have fallen asleep.
For the Lord Himself will descend from heaven with a shout,
with the voice of the archangel, and with the trumpet of God;
and the dead in Christ shall rise first.
Then we who are alive and remain shall be caught up
together with them in the clouds to meet the Lord in the air,
and thus we shall always be with the Lord.
Therefore comfort one another with these words."
1 Thessalonians 4:13-18
Special Note: Be sure to register under the subscribers' section at www.technicalindicatorindex.com for e-mail notifications and password access of our new mid-week market analysis, usually available on either Tuesdays or Wednesdays. These midweek updates are only available via password access when posted on the web.
| Key Economic Statistics | ||||||||
| Date | VIX | Mar. U.S. $ | Euro | CRB | Gold | Silver | Crude Oil | 1 Week Avg. M-3 |
| 3/26/04 | 17.12 | 89.30 | 120.90 | 278.25 | 422.3 | 7.71 | 35.73 | 9015.3 b |
| 4/02/04 | 15.81 | 88.80 | 121.12 | 280.00 | 421.1 | 8.15 | 34.39 | 9071.5 b |
| 4/08/04 | 16.38 | 89.82 | 120.56 | 284.00 | 419.9 | 8.09 | 37.14 | 9060.6 b |
| 4/16/04 | 15.00 | 90.18 | 119.50 | 276.75 | 401.6 | 7.14 | 37.74 | 9115.2 b |
| 4/23/04 | 14.01 | 91.34 | 118.18 | 267.50 | 395.7 | 6.16 | 36.46 | 9122.6 b |
| 4/30/04 | 16.69 | 90.76 | 119.70 | 270.75 | 387.5 | 6.07 | 37.38 | 9171.5 b |
| 5/07/04 | 18.13 | 91.30 | 118.83 | 270.40 | 379.1 | 5.58 | 39.93 | 9230.2 b |
| 5/14/04 | 18.47 | 91.81 | 118.69 | 267.00 | 377.1 | 5.72 | 41.38 | 9232.3 b |
| 5/21/04 | 18.44 | 90.53 | 120.05 | 268.75 | 384.9 | 5.87 | 39.93 | 9278.0 b |
| 5/28/04 | 15.52 | 88.98 | 122.10 | 276.25 | 394.0 | 6.11 | 39.88 | 9250.7 b |
| 6/04/04 | 16.57 | 88.50 | 122.93 | 274.75 | 391.7 | 5.81 | 38.49 | 9253.3 b |
| 6/11/04 | 15.10 | 89.23 | 121.01 | 269.25 | 386.6 | 5.78 | 38.45 | 9262.7 b |
| 6/18/04 | 14.95 | 89.41 | 121.17 | 267.75 | 395.7 | 5.98 | 39.00 | 9300.7 b |
| 6/25/04 | 15.19 | 89.22 | 121.41 | 270.75 | 403.2 | 6.12 | 37.55 | 9288.8 b |
| 7/02/04 | 15.15 | 88.18 | 123.09 | 265.50 | 398.7 | 6.01 | 38.39 | 9318.0 b |
| 7/09/04 | 15.78 | 87.41 | 124.10 | 269.00 | 407.0 | 6.46 | 39.96 | 9262.1 b |
| 7/16/04 | 14.43 | 87.12 | 124.36 | 271.50 | 406.8 | 6.72 | 41.25 | 9257.2 b |
| 7/23/04 | 16.50 | 89.23 | 120.88 | 269.50 | 390.5 | 6.33 | 41.71 | 9278.5 b |
| 7/30/04 | 15.27 | 90.12 | 120.10 | 267.00 | 391.7 | 6.56 | 43.80 | 9290.9 b |
| 8/04/04 | 19.34 | 88.45 | 122.69 | 268.25 | 399.8 | 6.77 | 43.95 | 9284.9 b |
| 8/13/04 | 17.98 | 87.97 | 123.68 | 269.19 | 401.2 | 6.62 | 46.58 | 9267.6 b |
| 8/20/04 | 16.00 | 88.22 | 123.03 | 279.50 | 415.5 | 6.87 | 46.72 | 9279.5 b |
| 8/27/04 | 14.74 | 89.80 | 120.20 | 275.00 | 405.4 | 6.58 | 43.18 | - |
Note: VIX, Euro, Gold, Silver and Oil Drop. Dollar up.


