


11/30/2010 8:25:41 AM
No reproduction, retransmission, or other use of the information or images is authorized. Legitimate news media may quote representative passages, in context and with full attribution, for the purpose of reporting on our opinions. Media interested in speaking to Mr. DeVincentis should email jay@stockbarometer.com to arrange a call.
The market is on the precipice of a potential major decline, but...
There is evidence that fear has reached a short term level allowing a bounce. But as I often describe the market as a simple rubber band, it gets stretched in one direction and the force grows to resist that move. However, there is a point where the rubber band may break.
We are very close to that point here. Monday's action (following a weak Friday) was a warning shot. And while the markets managed to recover, forming a potential spring, they did so in a hammer type fashion. Hammers have long lower shadows. This shadow is very important - as 1) it tends to get retested and 2) if that retest fails, look out below.
That's where we are. We discussed this for a bit in our chat room after the close. The markets have the potential to hold on here and rally. But the energy is short term. If they break down and close lower, they will likely initiate an intermediate term move lower that could last most of December (although the initial move will be a sharp quick move).
I know that's contrary to the popular message - but I just call it as I see it.
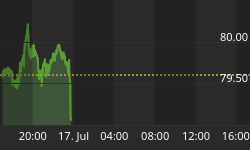
Let's start with a view of the world markets (this is as of this writing):

Weakness in Asia hasn't infected Europe yet, but US Markets are feeling the pain.
Here is the economic week ahead. As with any new month, the first Friday brings jobs. That's where our primary focus will be. If the markets sell off this week, they will pause ahead of this report.

One of our reports this morning: Not sure it will be enough to reverse the morning weakness.

To help you navigate the intraday action, we have a LIVE chat room that I am in every day. We run it on PalTalk. This will allow you to hear me, and chat with others. Upgrading will also give you access to my trading screen during the day so we can go over recommendations in more detail. Here's the link to sign up:

On to the charts:

Stock Barometer Analysis
When markets consolidate, so too do our indicators, and that's where we are. I can support a move in either direction here, but we'll remain in Sell Mode until this market breaks out of thisi pattern. If it breaks up, we will position long for an advance through this month. But until then, we're looking for a move lower into December 19th.
The Stock Barometer is my proprietary market timing system. The direction, slope and level of the Stock Barometer determine our outlook. For example, if the barometer line is moving down, we are in Sell Mode. A Buy or Sell Signal is triggered when the indicator clearly changes direction. Trend and support can override the barometer signals.
Money Management & Stops
To trade this system, there are a few things you need to know and address to control your risk:
- This system targets intermediate term moves, of which even in the best years, there are usually only up to 7 profitable intermediate term moves. The rest of the year will be consolidating moves where this system will experience small losses and gains that offset each other.
- This system will usually result in losing trades more than 50% of the time, even in our best years. The key is being positioned properly for longer term moves when they come.
- Therefore it is vitally important that you apply some form of money management to protect your capital.
- Trading a leveraged index fund will result in more risk, since you cannot set stops and you cannot get out intraday.
Accordingly;
- Make sure you set your stops so that you can lose no more than 2% per trade (based on the QQQQ if you're trading leveraged funds and options with our trading service).
Potential Cycle Reversal Dates
2010 Potential Reversal Dates: 1/19, 1/28, 3/2, 3/23, 4/7, 5/30, 6/10, 6/28, 7/10, 8/13, 9/7, 10/2, 10/27, 11/21, 12/19. We publish dates up to 2 months in advance.
12/19 is the last date of the year, so with the markets at their lows here, how they handle the retest is very critical.
My Additional timing work is based on numerous cycles and has resulted in the above potential reversal dates. These are not to be confused with the barometer signals or cycle times. However, due to their past accuracy I post the dates here.
2009 Published Reversal Dates: 1/20, 2/11, 3/7, 3/15, 4/8, 4/16, 4/27, 5/7, 6/8, 7/2, 7/17, 9/14, 10/10, 10/24, 11/12, 11/30, 12/9, 12/21, 12/29. 2008 Potential Reversal Dates: 12/31, 1/11, 2/1, 2/13, 3/6, 4/5, 4/22, 5/23, 6/6, 6/27, 7/13, 9/2, 10/3, 10/22, 11/10, 12/11. 2007 Potential Reversal Dates: 1/10, 1/14, 1/27, 1/31, 2/3, 2/17, 3/10, 3/24, 4/21, 5/6, 6/15, 8/29, 10/19, 11/29, 12/13, 12/23, 12/31, 1/11/08. 2006 potential reversal dates: 1/16, 1/30, 2/25, 3/19, 4/8, 5/8, 5/19, 6/6(20), 7/24, 8/20, 8/29, 9/15, 10/11, 11/28. 2005 Potential reversal dates: 12/27, 1/25, 2/16, 3/4, 3/14, 3/29, 4/5, 4/19, 5/2, 6/3, 6/10, 7/13, 7/28, 8/12, 8/30-31, 9/22, 10/4, 11/15, 11/20, 12/16.
Spread Indicators
Use the following spread/momentum indicators to assist in your trading of the QQQQ, GLD, USD, USO and TLT. They are tuned to deliver signals in line with the Stock Barometer and we use them only in determining our overall outlook for the market and for pinpointing market reversals. The level, direction, and position to the zero line are keys in these indicators. For example, direction determines mode and a buy signal 'above zero' is more bullish than a buy signal 'below zero'.
QQQQ Spread Indicator (NASDAQ:QQQQ)

The QQQQ Spread Indicator will yield its own buy and sell signals that may be different from the Stock Barometer. It's meant to give us an idea of the next turn in the market.
Gold Spread Indicator (AMEX:GLD)

Want to trade Gold? Use our signals with the Gold ETF AMEX:GLD. Gold gives us a general gage to the overall health of the US Economy and the markets.
US Dollar Index Spread Indicator (INDEX:DXY)

Want to trade the US Dollar? Use our signals with the Power Shares AMEX:UUP: US Dollar Index Bullish Fund and AMEX:UDN: US Dollar Index Bearish Fund.
Bonds Spread Indicator (AMEX:TLT)

Want to trade Bonds? Use our signals with Lehman?s 20 year ETF AMEX:TLT. The direction of bonds has an impact on the stock market. Normally, as bonds go down, stocks will go up and as bonds go up, stocks will go down.
OIL Spread Indicator (AMEX:USO)

Want to trade OIL? Use our signals with AMEX:USO, the OIL ETF. We look at the price of oil as its level and direction has an impact on the stock market.
Supporting Secondary Indicator

We daily monitor hundreds of popular and proprietary technical indicators that break down market internals, sentiment and money flow to give us unique insight into the market. We feature at least one here each day in support of our current outlook. As an annual subscriber to any of our services, you will get access to all our charts and research.
Summary of Daily Outlook
We remain in Sell Mode, looking for a larger move lower quite possibly into 12/19.
The markets broke down yesterday and bounced, setting up a potential spring higher. The lows of yesterday are in the process of being retested. It's frustrating, but it's the process the markets go through. A break and hold below these lows will initiate more selling across the board. It can come quick, so hang on tight and join us if you want to profit.
Are you busy this Saturday?
If not, then please join me from 10am to 2pm for an intense discussion on the future direction of the markets.
This Saturday, we are delivering our Sentiment, Cycles and Advanced Trading Seminar.
You can take this LIVE class from the comfort of your own living room - as we deliver the class through PalTalk (link below).
The best part of this class is that it is based on the current market action and that I expect you to participate. I want to hear from you, what your questions are, what stocks you're playing, etc. I keep the class size small so you can benefit from direct interaction. You will not only learn from this course, but I'll show you how to profit from the markets over the weeks ahead.
From 10am to 2 pm, we'll review the following topics:
1) What is Market Sentiment, What is it predicting now and how can I profit from it
2) Where are we in the current market cycles and where are we going
3) What trading style should you be using now and how do you set up your trades
4) What is Fibonacci and how can it improve your trading
5) What is our Forecast for the rest of the year and going into 2011
The cost of the course if $49.95 - you can sign up through the link below:
Sign up now and I'll email you two free eBooks for signing up. First is my Day Trading eBook - The AM Trader (a 19.95 Value), and second is the eBook version of Reminiscences of a Stock Operator - a must read for any trader or investor. If you haven't read it yet, you need to.
The course is delivered through PalTalk. A password code to enter the chat room as well as course material will be emailed out to you on Friday night before the class. If you haven't signed up for a PalTalk account (no cost) you can do so through the link below.
I look forward to seeing you on Saturday! Sign up early so I can put your email on the list and get materials out to you before hand.
-Jay D
For my clients who trade intra day - here are the indices pivots for today's trade.

I publish charts of the ES and Qs with pivots in the chat room every morning. Join me in the chat room if you want to see them, and learn how to use them.
A closer look at today's events: Note, Bernanke speaks tonight... We'll see how futures react tonight.

Here's a deeper look at the S&P Futures - these levels are very important if you're going to day trade the market.

These levels are important for both day traders and investors. How? Well, if you are going to take a stock position, it's always best to get the most efficient entry. Understanding that there are key pivots during the day and key levels that futures traders look for, will help you figure a better entry price (instead of just buying at the open). Combine these levels with the timing of the economic reports on the list at the top of the page, and you can really catch some nice swings in the market. More efficient trade entry increases your relative profit per trade.
If you have any questions or comments, email me at Jay@stockbarometer.com.
Regards,


