


Don't walk in front of me, I may not follow. Don't walk behind me,I may not lead. Just walk beside me and be my friend. ~ AlbertCamus
Euro

Chart 1 Euro Four Hour
Price whipped about on Friday and eventually took out our resistance line only to move to the more significant set of resistance which is in fact the downward sloping channel itself. Price moved to 134 and in fairness it was hard to see anything above 13450. Price has since pulled back from the downward sloping channel which can be clearly seen by our four hour chart. We would expect price to move lower but the action so far is basing at 13250 and that is what needs to be taken out so that price can re-enter the lower window of downward lows action.
We don't really want to see price move much higher than 13333 as this can trigger a re-attempt of 134. The indicator along the bottom is at similar levels to the last two previous declines from the high itself. We would expect to swing lower but must keep a look out for upward price swings as caution should be exercised as if this third leg triggers lower the nature of it would be very vicious and volatile.
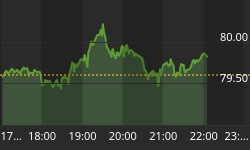
Dow Jones

Chart 2 Four Hour Dow Jones Chart
The Dow Jones chart is simply showing the current price action and what needs to be seen by all in relation to the highs set in November. The red ovals are placed on the chart depict precisely how price could fail from current levels or we could move higher to the previous new highs of the year. Taking this out would provide the market with another spurt of rallying activity but failure will likely take us lower. If 11275 goes to the downside then this recent resurgence of up moves could falter with it.
FTSE100

Chart 3 FTSE100 Four Hour Chart
It is concisely apparent to notice the 5800 mark which sticks out on the FTSE 100 chart. The market has had issues with this number before and could halt here once again. We would like to see the market halt at his point once again as a reversal here will likely reward at least 100 points to the downside. Of course taking this level out would leave the market wanting to aim for one number and one number only - 5900. We are sitting at some fine line points for many markets and within the next few sessions the directional fate will be printed. North or South, either way, at this stage in time, caution is required.
Tradingmarketsignals.com is proud to launch its lowest ever membership rate today. Join us for 6 months for only $99. Our XMAS Special rate is only open to 100 clients - 92 places left. So hurry up and join to avoid disappointment. In November the Dollar's rise helped our TMS system gain 3683 points. We feel 2011 is going to be a HUGE year with markets looking set to produce some real volatility. Some big surprises are set to occur as uncertainty is wrong footing many across the globe. Why not demystify these uncertainties with us using our unbiased technical ways...
Remember to join us at our lowest ever membership rate, limited places and limited time only: Exclusive Membership at TradingMarketSignals.com


