


Article By: Nu Yu, Ph.D. with Lorimer Wilson
Technical analyses of the future direction of the U.S. dollar, the price of gold and the American and Chinese stock markets suggest that the near term pattern for each should be somewhat choppy but with a favorable upward bias for gold and the markets. Let me illustrate my findings with the following charts and explanations.
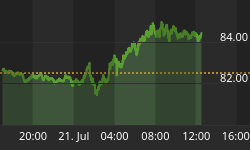
U.S. Dollar: Correction Pattern on Verge of Reversing?
The U.S. dollar index ($USD) completed the broadening descending right-triangle pattern and measured move up pattern last week reaching 81.44 in the projected price range between 81 and 82. The dollar is now in a correction pattern that could give a time-window for gold and stock markets to advance. It also could be setting up another bullish Measured-Move-Up pattern that consists of three parts: 1) 2nd up-leg, 2) a correction, and 3) 3rd up-leg as shown in the following chart. Once the correction ends the third up-leg could be projected at the same angle and length as the second up-leg which gives a price target of 82.5 within the next one or two weeks.

Gold: Forming A Long-Term Bump-and-Run Pattern
Gold is forming a Bump-and-Run pattern in a long-term timeframe as shown in the weekly chart below. This pattern typically occurs when excessive speculation drives prices up steeply. According to Thomas Bulkowski, this pattern consists of three main phases:
- A lead-in phase in which a lead-in trend line connecting the lows has a slope angle of about 30 degrees. Prices move in an orderly manner and the range of price oscillation defines the lead-in height between the lead-in trend line and the warning line which is parallel to the lead-in trend line.
- A bump phase where, after prices cross above the warning line, excessive speculation kicks in and the bump phase starts with fast rising prices following a sharp trend line slope with 45 degrees or more until prices reach a bump height with at least twice the lead-in height. Once the second parallel line gets crossed over, it serves as a sell line. Gold currently is in the bump phase, and its uptrend may continue as long as prices stay above the $1350 sell line.
- A run phase in which prices break below the sell line often causing a bearish reversal to happen.

Overall Stock Market: Sideways Pattern About to Move Higher?
The Dow Jones Wilshire 5000 index, as an average or a benchmark of the total equity market, has been in a six-week horizontal sideways channel pattern and is currently in the choppy zone of the horizontal channel. The readings of both the trend and momentum indicators have turned positive as has the Leading Wave Index (LWX) indicator, color coded in the price bars of the following daily chart of the Wilshire 5000 index, which turned positive last Friday.
Based on the forecast of the LWX indicator, the market could enter a neutral time-window that could last weeks until higher market volatility is released. However, if the Wilshire 5000 index breaks through the resistance at the upper boundary of the horizontal channel, the market could become very bullish with the reason that will be explained in the next section below.

S&P 500 Index: Continuing Bullish Pattern - to 1440 (and 13245 for the Dow)?
The S&P 500 index is forming a 8-month Cup-with-Handle pattern as shown in the following weekly chart. This is a bullish continuation pattern having two parts: 1) a cup, and 2) a handle. The prior 13-month uptrend which saw an 83% advance from March of 2009 to April of 2010 led to the cup. As the cup was completed, the market spent seven weeks in the current horizontal trading range on the right hand side to form the handle. Once the upper resistance is broken, the market should continue its previous uptrend.
An upside price target for the S&P 500 index could be projected at 1440 which is about an 18% advance as measured by the height of the cup. Correspondingly, it could be 15400 for the Wilshire 5000 index, and 13245 for the Dow Jones industrial Average index. Please note that the time span of these price objectives is in the intermediate term, rather than the short term.

Chinese Stock Market Pattern: Testing 17-Week Moving Average on Way to 4200?
The chart below is a weekly chart of China's Shanghai Stock Exchange Composite Index (SSECI). The index retreated after China reported higher-than-expected inflation and renewing concerns that the China's central bank will raise interest rates again. Currently the Shanghai index is testing the 17-week moving average (equivalent to the 89-day moving average). That being said, previous analyses strongly suggest that the SSECI should achieve its index target of 4200 by mid-2011.

Which Developing Chart Pattern Do You Intend to Take Advantage Of?
Please Note: Don't forget to sign up for munKNEE's FREE weekly "Top 100 Stock Market, Asset Ratio & Economic Indicators in Review"


