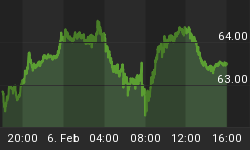
Contrary to Bernanke's goal of lowering interest rates by the QE II intervention, rates have been rising. In fact, they have begun to rise steeply as of late, with corresponding decline in bond prices. The following two charts for the 10-year Treasury bond illustrate the situation (top chart yield, bottom chart price). Better cash than bonds right now - or high quality, high yield growth US equities.

Gold line is 52-week average. Purple lines are 13-week highs and lows. Red line below is percent change over 13 weeks.


