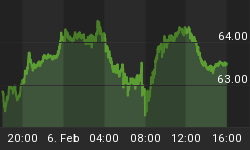
The big, Institutional Index test that is now going on ...
Last Tuesday, we posted the Institutional Investor "core holdings' chart. The core holdings are the collection of stocks that represent most of the investment money Institutional investors have in play.
The stocks making up the index change fairly often ... as often as Institutional investors change their strategies. Actually, that is one of the good features about the index because it reflects what is really going on relative to their investment behavior.
But ... what is interesting about the index, is that it gives one of the most accurate index pictures of what is happening in the stock market. And, since it is not really a public index, it can't be manipulated, toyed with, or otherwise be interfered with.
If you recall last Tuesday's update, we commented that the Institutional Index was facing a "double top" resistance test. This is really an important test, as it will be a deciding factor whether the current rally starts another leg up in January, or decides to retreat.
The current Institutional Index chart is posted below as of Friday's close. (It is updated every morning on our paid subscriber site.) Anyway, take a quick look at the chart and you will see the "double top" resistance test that is going on now.
During the past week, Institutional Investors were seen increasing their level of Accumulation, so that is a positive bias that is starting to build for breaking through the upcoming resistance.


