


The S&P 500 Index yesterday advanced for the 13th time in 15 sessions, reaching a two-year high - a level last seen before the collapse of Lehman Brothers in September 2008. According to the Advisors Sentiment of Investors Intelligence, the percentage bulls increased to 58.8% over the past week - a new high since October 2007 when the number peaked at 62.0%.
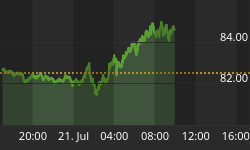
A flood of liquidity has propelled the Index to 85.4% above the bear market low of March 9, 2009, meaning another 24.8% increase is required to reach its all-time high of October 2007. The chart below, courtesy of Doug Short, illustrates the up and down movements.

Source: dshort.com, December 21, 2010.
The tables below indicate the 50- and 200-day moving averages for most important global stock markets, with the top table showing mature markets and the bottom one emerging markets. The key numbers to focus on are the columns titled "STDEV from 50 Day" and "STDEV from 200 Day". The figures show how many standard deviations various stock market indices are above the moving averages (red) or below the averages (green).


It is interesting that a number of bourses are very extended relative to their moving averages, including Northern Europe, U.S. large caps, U.S. small caps and a variety of emerging markets (including the MSCI Emerging Markets Index that trades 2.2 standard deviations above its 200-day mean).
At the other end of the spectrum, the markets that have corrected most significantly include over-indebted situations such as Greece, Belgium, Spain, Portugal and Ireland. A few former high-flying emerging markets such as Brazil have also seen significant mean reversion to the key moving averages.
The nascent rally could extend into January, but one should be very cautious here given the overextended condition of some markets, especially against the background of the overbullish sentiment, and run with fairly tight stops.
Did you enjoy this post? If so, click here to subscribe to updates to Investment Postcards from Cape Town by e-mail.


