


2010 was a tumultuous year. Around the world it seemed that quite often, chaos reigned. There were natural disasters: earthquakes rocked Haiti, Chile and China. The Haiti earthquake was the most devastating since the Sumatra, Indonesia earthquake and tsunami of 2004, with estimated deaths of over 250,000. A summer heat wave and drought in Russia caused wheat prices to soar. A volcanic eruption in Iceland, while not huge in the scale of volcanic eruptions, disrupted air travel across Europe. As the year ended, snow and ice storms across Europe, the north-eastern US and Atlantic Canada were also causing disruption.
There were man-made disasters: the BP rig exploding in the Gulf of Mexico caused the worst oil spill in US history and one of the worst ever anywhere. There were financial disasters: Greece had to be bailed out while other Euro Zone nations saw their credit downgraded, including Ireland, all of which damaged the euro. As a result of the European debt crisis, governments attempted to impose austerity programs. The result: riots in Greece, France, Britain and Ireland as the programs were rejected by the people, even as the bankers behind the financial mess were bailed out and paid themselves handsome bonuses.
The US dollar at one point stood at an all-time low against the yen. Financial scandals rocked Wall Street, including an insider probe implicating tech companies and top investment firms. Goldman Sachs was investigated for fraud related to derivatives trading surrounding the subprime mortgage loans mess. It transpired that financial institutions may be holding billions of dollars of soon-to-be worthless mortgage paper as a scandal widened over who actually held the mortgage deeds. An investigation was launched against the giant accounting firm Ernst & Young into their work at firms that were at the centre of the financial panic and collapse of 2008. The US housing crisis continued with record foreclosures against the backdrop of continued high unemployment.
Wars continued in 2010. The Afghanistan war widened as the US added more troops and made forays into Pakistan to fight an elusive enemy. Costs now exceed $300 billion. Despite US troops pulling back in Iraq, bombings continued and the country again came close to civil war before a government was finally formed. War loomed between the two Koreas; the US sent a nuclear carrier into the Yellow Sea, which is in China's backyard. Russia provided nuclear fuel rods for Iran's Bushehr reactor. War drums continued in the background from the US and Israel over Iran's alleged nuclear program.
Politically it was a topsy-turvy year in the US. The Democrats were soundly beaten in November's midterm elections as the influence of the "Tea Party" shook the landscape. Governments in Ireland and Greece were threatened with overthrow after introducing their austerity programs. And in what may have been the biggest story of the year, WikiLeaks and its founder Julian Assange released thousands of diplomatic dispatches confirming intrigue, deception, lies and torture in the wars in Iraq and Afghanistan.
Despite all this the stock market soared. When it topped in April 2010 and fell sharply into May/July, there was grave concern that markets would slide further. The Fed came to the rescue with a second round of quantitative easing (QE2) and the markets recovered.
When Congress was overturned in the midterm elections the President was forced into compromise mode. A tax deal was forged that extended the Bush tax cuts, including those for the very wealthy. It also extended benefits for the unemployed. This added more stimulus. Couple this with the knowledge that the Fed was not about to hike interest rates from their near-zero level and an unprecedented wave of liquidity was unleashed on the market.
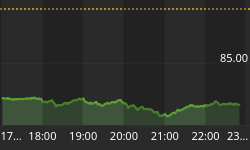
Money growth, which had faltered in the early part of the year, began to grow quickly once again. The chart shows that MZM money stock (Money with zero maturity. It measures the supply of financial assets redeemable at par on demand) was actually contracting for several months. Without a rapidly expanding money supply the US economy could well have slipped back into recession. Rapid monetary growth (it is once again approaching 10 per cent for M2) is the fuel that could ignite yet another bubble.

Source: Federal Reserve Bank of St. Louis
The stock market was saved by another round of unprecedented liquidity. Given the very low risk factor, the funds intended for loans to the broader economy instead found their way into risk assets both domestically (stock market) and abroad, in securities in emerging markets. Loans were not being made into the broad economy as lending rules have tightened considerably and many are no longer qualified because of the huge level of foreclosures and bankruptcies.
The broader economy remained in a deep funk, with record foreclosures and persistently high unemployment. Housing prices in the US have continued to fall and the supply of unsold homes remains near record levels. Unemployment is officially reported at 9.8 per cent but may be as high as 22 per cent when one includes workers who have given up looking for work, part-time workers who really want full-time jobs, and the very long-term unemployed.
Debt continues to mount. The US is running vast annual budget deficits that by some methods of calculation may be as high as $5 trillion annually (GAAP method - generally accepted accounting principles) and not the reported $1.3 trillion. The official gross US debt has reached roughly $13.6 trillion, but when one adds the unfunded liabilities of Medicare, Social Security and Medicaid, plus the liabilities of Fannie Mae and Freddie Mac, the total may be anywhere from $59 trillion (official reports) to $200 trillion.
No matter how one looks at it, many are noting that the US is in effect insolvent over the long haul because even if taxes were hiked to 100 per cent it would still not cover the long term liabilities. No wonder Moody's and other rating agencies have issued warnings about the possibility of downgrading US debt, which could prove to be catastrophic for the US and for the global financial system.
One unintended consequence of QE2's injection of liquidity into the financial system is that long-term interest rates are actually rising. Ten year US Treasury notes have jumped to 3.50 per cent from under 3 per cent this past month. Foreign investors, who own over half of the public debt of the US, are backing off from Treasury bond auctions and are even selling into the market. Yet the world focuses on Europe and the troubles of a few smaller countries such as Portugal, Ireland, Greece and Spain (PIGS), while the debt woes of several individual US states that may be bigger than the PIGS go largely ignored. Not, however, being ignored is the ongoing collapse of the municipal bond market. Many US municipalities are in serious trouble and municipal bonds, a staple of many portfolios, have plunged considerably in price in 2010.
It is with this financial mess in the background that the markets go into 2011. But the stock market appears to be largely oblivious to the background noise. With only a day left in 2010, the S&P 500 is up roughly 12.8 per cent. The Dow Jones Industrials has gained about 11 per cent, the NASDAQ is up just over 17 per cent, and the S&P TSX Composite has jumped almost 14 per cent.
All in all, a good year. It has been a year that has defied the decennial cycle. Years ending in zero tend to be down years. Since the inception of the Dow Jones Industrials in 1880, years ending in a zero have a current tally of eight down and four up. This is the worst record for any year over the decade.
| decades | 1st | 2nd | 3rd | 4th | 5th | 6th | 7th | 8th | 9th | 10th |
| 1881-90 | 3.0 | -2.9 | -6.5 | -18.8 | 20.1 | 12.4 | -8.4 | 4.8 | 5.5 | -14.1 |
| 1891-00 | 17.6 | -6.6 | -24.6 | -0.6 | 2.3 | -1.7 | 21.3 | 22.5 | 9.2 | 7.0 |
| 1901-10 | -8.7 | -0.4 | -23.6 | 41.7 | 38.2 | -1.9 | -37.7 | 46.6 | 15.0 | -17.9 |
| 1911-20 | 0.4 | 7.6 | -10.3 | -5.4 | 81.7 | -4.2 | -21.7 | 10.5 | 30.5 | -32.9 |
| 1921-30 | 12.7 | 21.7 | -3.3 | 26.2 | 30.0 | 0.3 | 28.8 | 48.2 | -17.2 | -33.8 |
| 1931-40 | -52.7 | -23.1 | 66.7 | 4.1 | 38.5 | 24.8 | -32.8 | 28.1 | -2.9 | -12.7 |
| 1941-50 | -15.4 | 7.6 | 13.8 | 12.1 | 26.6 | -8.1 | 2.2 | -2.1 | 12.9 | 17.6 |
| 1951-60 | 14.4 | 8.4 | -3.8 | 44.0 | 20.8 | 2.3 | -12.8 | 34.0 | 16.4 | -9.3 |
| 1961-70 | 18.7 | -10.8 | 17.0 | 14.6 | 10.9 | -18.9 | 15.2 | 4.3 | -15.2 | 4.8 |
| 1971-80 | 6.1 | 14.6 | -16.6 | -27.6 | 38.3 | 17.9 | -17.3 | -3.1 | 4.2 | 14.9 |
| 1981-90 | -9.2 | 19.6 | 20.3 | -3.7 | 27.7 | 22.6 | 2.3 | 11.8 | 27.0 | -4.3 |
| 1991-00 | 20.3 | 4.2 | 13.7 | 2.1 | 33.5 | 26.0 | 22.6 | 16.1 | 25.2 | -6.2 |
| 2001-10 | -7.1 | -16.8 | 25.3 | 3.1 | -0.6 | 16.3 | 6.4 | -33.8 | 18.8 | |
| 8 up 5 dn | 7 up 6 dn | 6 up 7 dn | 8 up 5 dn | 12 up 1 dn | 8 up 5 dn | 7 up 6 dn | 10 up 3 dn | 10 up 3 dn | 4 up 8 dn |
Despite the gains of 2010, the markets generally remain down on the last decade. The S&P 500 is still 14.2 per cent below its level on December 31, 1999. The Dow Jones Industrials has eked out a gain of about 1 per cent, while the S&P TSX Composite, thanks to its energy and metals components, has jumped 59 per cent. The big winners are gold (up 388 per cent), silver (up 465 per cent), and oil (up 256 per cent).
If there were something for US stock markets to cheer about in 2010, it was that the second year of the four-year presidential cycle is usually a positive year. That proved to be the case once again. And if the presidential cycle holds true for 2011, then 2011 may be even better, as the third year of the cycle is usually the best of the four. In fact there hasn't been a losing year in what is the pre-election year since 1939, when Franklin Roosevelt was President.
For the past decade the markets have followed the cycle of the 1930s remarkably well. There has been an interesting overlay with the Nikkei Dow market of the 1990s as well.
Below is a chart (inflation adjusted) comparing today's market from 2000 with the DJI of the 1930s and the Nikkei Dow of the 1990s. Note how all three swooned at some point during their tenth year and then attempted, to varying degrees, a year-end rally. But the early part of the eleventh year was not friendly: 1941 saw a top in early January followed by a fall into February before a rebound got underway that lasted into July/September. The Nikkei Dow could not find a bottom until mid-March 2001, when a feeble rally got underway. Could the Presidential cycle override what appears to negative cycles?
Today's markets could be swinging away from the 1930s and 1940s pattern. It is possible. If the presidential cycle is being adhered to, it would be better to look at the period 1948 to 1952, which fits the master cycle of 60 years (and the Fibonacci 61.8).
During that period, 1950 saw a top in June and a low in July. The July 2010 low coincided with that of 1950, although the top was seen in April 2010. What followed in 1950 was a rally into year-end and, following a pause, a strong rally that carried into May 1951 before a correction got underway. Following that correction, the market generally traded in an irregular sideways pattern for the remainder of 1951 and through 1952.
The 50-year cycle is worth a look: there was a top in the stock market in early 1960, followed by a deep correction into 1962. The 100-year cycle can also be very influential: there was a top in January 1910 followed by four years of a sideways-to-down market.
And ninety years ago there was also a market top (in January 1920). After considerable back and forth, the market failed to find a final bottom until May 1924. The early part of that decade gave few clues to the huge blow off that was to come in the final five years.
Finally, most readers will still remember the tops of January to March 2000 and the devastating collapse into October 2002. No matter where one looks past cycles appear to be negative as the market heads into 2011.

Source: www.dshort.com
If the markets are to rally strongly into at least mid-2011, the fuel supplied by rapid monetary growth, QE2 and continued low interest rates will be key. Precedents abound, particularly the periods 1998 to 2000 and 2005 to 2007. Both were characterized by high monetary growth and consistently low interest rates. That long-term rates are now rising is insufficient at this time to derail a potential runaway stock market move. The funds are primarily coming from the financial institutions (banks, investment dealers, hedge funds). However, a rapid stock market rise will at some point become dangerous as blowoffs are always followed by steep rapid declines.
If there is a big negative on the horizon in 2011 it is that the US debt limits will be hit sometime into the late first or early second quarter. Given that the new Republican congress and Republican senators have promised to fight any increase in the debt limit this could give rise to a complete shutdown of government. This confrontation will be a game of brinkmanship but it could also prove to be disastrous for the US stock market. This is an event to watch carefully in 2011.
There is a huge disconnect between the broader economy and the economy dominated by the powerful corporations and financial institutions and those who run them. Much has been said about how the rich are becoming richer while the middle class disappears, to be replaced by a large and permanent underclass. The Gini coefficient, a measure of distribution of wealth and income, has for the USA risen since 1980 from the mid to high 30s to the mid-40s. This puts the US on a par with numerous third world countries. It is the highest coefficient for the US since 1929, just before the Great Depression.
A rising stock market is not necessarily a sign of a healthy economy, if it is being fuelled by monetary policies intended to bring about a rising stock market. And a rising stock market usually benefits only a small percentage of the population. Most of the population remain in low-paying jobs or unemployed and with little hope following the great housing crash of 2007.
While the markets saw slightly higher highs in 2007, the thought remains that the economy and stock market remain in a "secular" bear market. These long-term bear markets can go on for a period of 16 to 20 years - witness the secular bear markets of 1929-49 and 1966-82. But as everyone knows, powerful rallies can take place within a bear market. Between 1966 and 1982, the market revisited the highs of 1966 a number of times before once again plunging.
Stock cycles analyst Michael Jenkins (www.StockCyclesForecast.com) has pointed out that there are numerous long-term cycles all meeting through this time period. He notes that 2,000 years ago the "Fall of Rome" got underway. Today's Rome is the Anglo-American empire which is by most calculations teetering on the edge of bankruptcy and involved in a series of potentially unwinnable wars. For sure it took the Roman Empire another 500 years to destroy itself, but the long collapse saw a series of currency devaluations and the build-up of huge and unsustainable debt levels.
A thousand years ago we had the beginning of the Crusades, undertaken in the Middle East. It was therefore odd that former President George W. Bush saw his wars in the Middle East as a crusade. The Crusades were undertaken to restore Christian control of the holy lands. They continued irregularly from 1095 to 1291, a period of nearly 200 years. Today's wars are in only their tenth year, at a cost now exceeding $1.4 trillion.
Five hundred years ago there was the rise of the Protestant reformation under Martin Luther. It was the beginning of a period of exploration that saw the Europeans conquer North America. Two hundred years ago we had the Napoleonic wars of the early 19th century and the War of 1812 between Britain and the USA. A hundred years later saw the global conflict of WW1 that resulted in the defeat of Germany and the fall of the Ottoman Empire. The consequences of the latter are still being felt today. Ironically there is a new rise of the Ottoman Turks underway. Could that be something to watch in the future?
One hundred and fifty years ago was the Civil War in the USA. Today it is a cultural civil war underway between the secular north-east; north-west and west against the religious right dominate in the US south and mid-west. The movement is led ostensibly by the "Tea Party".
Ray Merriman (www.mmacycles.com) cites long-term cycles of economic depression and stock market collapses that appear to occur at roughly 72-year and 90-year frequencies. The last one, the Great Depression, was a convergence of those two cycles.
The 72-year cycle shows pronounced stock market bottoms in 1784, 1857 and 1932 (intervals of 73 and 75 years). The subsequent lows of 2002 and 2009 were 70 years and 77 years after 1932, so it is possible that these are coinciding with the 72-year cycle stock market low.
The 90-year cycle may well measure from a stock market low of 1762. Ninety years later was 1852, and there was a stock market low in 1857. There was an earlier low in 1842, just as 1762 was followed by another low in 1784 noted above. Next were the major lows of the Great Depression, first in 1932, with the secondary low in 1942. If these series of lows related to the 90-year and 72-year cycles and if we follow the path, then a secondary low could occur anywhere from 2012 to 2022 and in an extreme out to 2032.
This long-term chart of the Dow Jones Industrials shows clearly those stock market lows of 1842 and 1857, then again in 1932 and 1942. If the 72-year and 90-year cycles are correct, then the lows of 2002 and 2007 are too close together to qualify as both a 72 and 90 year stock market low. While they may well be the lows of the 72-year cycle, the longer 90-year cycle is still in play.

Source: www.sharelynx.com
There is also the long-term Kondratieff cycle of recession/depressions. This is a much shorter 50-60 years and is last considered to have bottomed in 1949. The idealized Kondratieff Wave cycle is shown below. It corresponds with depressions that occurred in the late 18th century, the depression of 1836-42, the Long Depression of 1873-96 and the Great Depression of 1930-42. The Kondratieff long wave is generally not accepted by traditional economists but there is some evidence that it does exist. Significantly, a period of 50-60 years from 1949 encompasses the past decade, which culminated in the financial panic of 2008 and stock market low of 2009. But given the possible influence of the longer 72-year and 90-year cycles, this particular Kondratieff Wave may not yet have seen its nadir. At the end of the other long waves the culmination of debt build-up was largely cleansed via bankruptcy and defaults. Today this process is still being worked out.
Outstanding US consumer debt has been in decline since 2008. It topped out in the first quarter of 2008 at $13,923 billion. At the end of the third quarter in 2010 it stood at $13,429 billion, down 3.5 per cent. Total outstanding business debt has also declined since peaking in the first quarter of 2009. What has grown is government debt, as government attempts to replace the declining consumer and business debt.
The Kondratieff winter, which is the last phase of the Kondratieff Wave cycle, is a period of debt repudiation. And debt collapse is by its nature deflationary. But it is also a period when trade wars break out, when confidence in the currency is lost and currency wars are normal. It is a period when the barbarous relic, gold, once again becomes a store of value. Unemployment is up; economic tensions among the people who are being asked to pay for the sins of the financial institutions are high; and even as debt collapse is deflationary, metals and oil have been in a bull market. Such are the characteristics of the Kondratieff winter. By most measurements this cycle is not yet over and is probably being stretched by the presence of the longer 90-year cycles.

Source: www.longwavegroup.com
Attempts by the authorities to flood the system with money are not having the desired effect. The velocity of money (defined as the average frequency with which a unit of money is spent in a specific period of time) is slowing, even falling. The chart below of M2 velocity shows that it has been declining since the late 1990s. This means that all the money the monetary authorities are throwing into the system in order to kick start the economy is having less and less effect. This suggests that it will take increasing amounts of (unsustainable) monetary growth (usually translated as more debt) to purchase each additional dollar of GDP.

Source: Federal Reserve Bank of St. Louis
Shorter cycles are also at play. The well-known Kitchin cycle of 3-5 years is what plays as a series of stock market lows about every four years. From the Great Depression low of 1932, stock market lows were seen in 1938, 1942, 1946, 1949, 1953, 1957, 1962, 1966, 1970, 1974, 1978, 1982, 1987, 1990, 1994, 1998, 2002, 2005 (very shallow) and 2009. The next Kitchin cycle low is due anywhere from 2012 to 2014.
Still to be determined is the timing of the peak of the current cycle. In theory it could occur as late as 2012. As noted earlier, the combination of continued low interest rates, rapidly growing money supply and QE2 could well set the market on course for a blow off in the first half of 2011. If that were to happen then the S&P 500 could well equal or exceed the highs of 2007. The cycles in the second half of 2011 are not as favourable as they are in the first half, so the peak could occur before June. If that were to happen then the collapse when it comes could prove to be devastating and catch many off guard. As noted earlier watch the potential fight over the US debt limits in 2011 as a possible catalyst for a stock market swoon.
The destruction of the boomers' retirement plans continues. With the broader economy mired in the subprime housing collapse, debt collapse and high unemployment, that situation is not about to change any time soon, no matter how much money is thrown at it.
One thing is sure, though. Gold, metals and oil will undoubtedly soar along with the broader market, and even if the broader market does not soar. The conditions for gold have never been better and prices as high as $2,000 and even the inflation-adjusted 1980 high of $2,200 could well be seen in 2011. Oil prices could well top $100 and reach as high as $150. Metal prices, currently led by copper, continue to show few signs of abating as shortages grow.
The secular bear market that got underway in 2000 is not over. The presence of the long-term cycles ensures that the current depressed conditions have many years to run before the debt is finally cleansed. And the Western economies still have to deal with the massive build-up of government debt that continues to threaten all. 2011 could well be a transition year following 2 years up from the lows of 2009. This pattern of roughly 2 years up 2 years down was somewhat prominent during the period of the Great Depression 1929-1949 and also showed up in the inflationary 70's and stock market bear 1966-1982. Some things never change.
David Chapman is a director of Bullion Management Group Inc. the Manager of the BMG BullionFund and the BMG Gold BullionFund www.bmgbullion.com


