


A 3-dimensional approach to technical analysis
Cycles - Structure - Price projections
"By the Law of Periodical Repetition, everything which has happened once must happen again, and again, and again -- and not capriciously, but at regular periods, and each thing in its own period, not another's, and each obeying its own law ... The same Nature which delights in periodical repetition in the sky is the Nature which orders the affairs of the earth. Let us not underrate the value of that hint." -- Mark Twain
A Review of the Past Week
There was very little change in the market averages this week, most trading in a narrow range including some of the important leading indexes, the XBD and the BKX. One notable exception was the Dow Jones Transportation Index, which continues to surge ahead and is now trading at a four year high-- perhaps a prognostication of things to come for the rest of the markets ... but not just yet! Last Monday, an email addressed to the readers on our Signal Alert list read:
--This was stated in the 9/03 Closing Comment: "The next Fibonacci projection would be 1137, and the most I can squeeze out of the P/F is 1134, so, If we do not see signs of real weakness in the next few days, I would look for that area to be the next target and most likely the end of the short term trend."
Well, we have yet to see signs of real weakness and we are approaching those levels. Whether or not we can reach them is another story. Although there is no real weakness just yet, there are many signs of deceleration which is a prelude to real weakness. Right now, the SPX may have problems getting above 1131/32.
I believe that what we may be doing , based on the current cyclic configuration, is making a rounding top with weakness coming in gradually after the highs have been reached and accelerating into -- probably -- the second week of October where the next low is expected to take place.
The SELL ALERT remains in effect. Remember! A SELL ALERT is not a SELL SIGNAL! It simply means that there is ample evidence that we are approaching a turning point and that you should be particularly alert. --
The stock market action this week has, if anything, reinforced this opinion.
Current Position of the Market.
Long Term Trend: The long term trend turned up in October 2002 in conjunction with the 12-year cycle. It is still in a BUY/HOLD mode, and is likely to top out at some point in 2005.
Intermediate Trend: A BUY ALERT remains in place for the SPX. Prices have not yet moved out of their intermediate downtrend channel, and another pull back into October is likely before breaking out on the top side.
The Short Term Trend is topping. Because of market volatility, the short term trend is better analyzed on a daily basis. This is done in our daily market updates and closing comments.
Note: If you would like to receive an explanation of how I arrive at these signals, how to use them in a trading strategy and be notified on the day that they occur, please let me know at ajg@cybertrails.com
The Short Term Trend is being monitored continually through daily Closing Comments.
IMPORTANT NOTE: If you have requested to be placed on our email Signal Alert list and have not been receiving emails on a daily basis, please notify me so that I can identify the source of the problem.
What's next?
Although it appears that little change took place this past week, this is not so! As previously mentioned, this was week 233 from the SPX 2000 top and that could mark a top in the same manner that the 89th week from the October 2002 lows marked a top. The other is that we appear very close to completing an important structural pattern. After putting the short term trend under a microscope, I sent the following email to the Signal Alert list on Friday morning:
-- "Finally, some clarity! This is what it looks like:
1. SPX 1095 was the low of the short term trading cycle. Today may very well be its high point
2. From 1095, we have made a 5-wave pattern, with today being wave 5 of 5.
3. The 5th wave of the 5th wave is itself probably breaking down into 5 waves. Wave 3 (or 5) has reached 1130.48 and is pulling back into what appears to be a wave 4. (1130.48 could turn out to be the top)
4. It there is another short term up wave, it will be wave 5 of 5 which should reach 1132, or very close to it.
5. All this is happening on negative divergence in just about every momentum indicator, and especially in the hourly A/D
6. The QQQ is not confirming this move and is much weaker than the SPX
This looks very much like the top of the short term up trend!.
Confirmation would be selling after reaching the 1132 area or thereabout, and then continuing to decline below the 1120 level. Breaking that level need not occur today, and probably won't, but this would be the new trigger point for a SELL SIGNAL instead of 1114.
This is the POTENTIAL scenario for the top of the short term up trend. " --
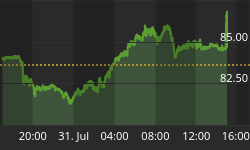
Three perspectives on the market: Patterns which are not readily apparent on longer term charts become more obvious when broken down into shorter time frames. This is illustrated on the charts of the SPX that follow.


The daily chart provides a good overview of the intermediate term correction from March to the present. It suggests that the correction most likely came to an end at 1060, but we have neither broken out of the down channel, nor have we overcome the last high. Furthermore, the stochastics has been very overbought for some time, and the MACD is beginning to roll over with the histogram showing the loss of momentum more clearly.
The next chart, an hourly chart, addresses the short term trend specifically, showing a clearly discernable pattern of deceleration in all of the underlying indicators as well as the boundaries of a channel which defines the up trend since the 1060 lows. Note how prices are pulling further and further away from the top of the channel, and are currently just barely hanging on the mid-point.
The third chart is a 15-minute chart of the SPX and QQQ. It shows the price deceleration and rounding pattern of the short term trading cycle which is losing its upside momentum as the intermediate term cycles due to make their lows in October are beginning to bear down.Youwillalsonote that the QQQ has not joined in the last little up thrust of the last two days of trading.
SUMMARY: The intermediate term trend continues to improve and prices are beginning to challenge the upper reaches of the channel which marks the correction from the March 2004 highs, but we don't appear to be in a position to break out decisively to new highs before one more pull-back.
Last week's letter stated: "The short term trend has become extended, is showing signs of deceleration, and is meeting with increasing overhead resistance. A few more days of top building seems likely."
This appears to be what is taking place. We are at or very near projected price levels, the structure is either complete or nearly complete, and this time frame is where a top should occur.
A short term SELL SIGNAL would be generated if the SPX dropped below 1120 on negative breadth readings.


