


Just when it seems that the market is getting ready for a return to rationality, unchecked optimism (or, more likely, fear of missing a Big Bull Market) bobs to the surface. It is turning out to be amazingly hard to keep this inner-tube submerged...but just wait until there is a hole in it.
Late in the day, the headline from Bloomberg said "Stocks rally on oil's decline." An editor, perhaps doing some rudimentary fact-checking, noticed that Crude was down a whopping 32 cents and added "...and initial claims drop." This later changed to the vague "Stocks Rise Most This Year on Economy", apparently in a concession to the fact that S&P futures had gained 14 of the session's 24 points before Initial Claims - or any data - had been released.
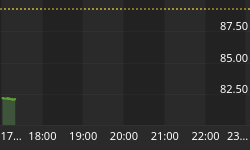
The ISM Non-Manufacturing Report was as-expected at 59.7, but there is no doubt that Initial Claims was positive as it came in at a multi-year low print of 368k. The volatility continues - or is this genuine improvement? Economists will seize on this as confirming their null hypothesis (improving trend), and it is sure that it doesn't disprove it while it nearly disproves my null (that a new lower equilibrium was in force in the low 400s). The only reason these numbers don't already disprove my hypothesis is that we can't yet distinguish between trend and volatility because the numbers are jumping around so much. Still, 'jobs hard to get' and other employment indicators are improving so it seems more likely that the jumbled mass of economists are right and I'm wrong. The chart of Claims (see below) certainly suggests a downtrend, but until the last couple of weeks the improvement from 460k to 425k was the only thing that looked reasonably conclusive (after all, in January we still had two prints above 440k) and the "false breakout" in August that ironically helped produce QE2 was what made the trend look optically trend-like prematurely. Imagine that: for a change, humans' (and even economists') tendency to try and see patterns in the data actually worked in our favor, rather than leading us astray!

The downtrend isn't as clear statistically as it looks to your eye - but it seems to be real.
But while an Initial Claims reading that looks pretty good probably helped hold up the stock market as investors who would otherwise be reducing risk before Employment, it doesn't explain the biggest gain of the year (although on barely 1bln shares).
It is easier to explain the bond market's performance. The 10y note contract was only down 7/32nds until Claims, and it ended the day down 28.5/32nds with the 10y yield back up to 3.57%. In addition to strongish economic data, there was hawkish talk from the ECB.
Although the ECB bravely decided to keep rates unchanged, President Trichet made some statements in the post-decision presser that scared bond folks. The Bloomberg headline was "Trichet Says ECB May Raise Rates, Show 'Strong Vigilance'".
The editors can be excused this time for missing nuance and irony. What he actually said was that an "increase of interest rates in the next meeting is possible. Strong vigilance is warranted." Sure, anything's possible. PIIGS might fly. Trichet then added that such a move would not necessarily start a "series" of hikes. I'm not sure how one token tightening could be considered "strong vigilance," and that incongruity (taken together with the fact that the energy shock will slow European economies, at a time when Ireland and Greece and probably Portugal and Spain and maybe the EU itself cannot endure very much of a slowdown) means that his comments should not be taken at face value. It is very easy to sound tough about inflation. Wake me when the first tightenings happen in a year or two. (Let me apply a small caveat. I can actually imagine a one-off tightening just to look tough, but even that is tantamount to yelling fire in a crowded theater: since no one would know that only one tightening was planned, the markets would get predictably crushed).
The currency guys loved the Trichet strong-man routine, however, and bid up the Euro. This sent the dollar to its lowest level since November and threatening 2010 lows as well as the uptrend-line from 2008-2010 (see Chart).

Weak dollar tends to increase inflation risks. With a big lag, of course.
This helped push inflation swaps to their highest levels of the year; 5y inflation swaps are at their highest levels (2.53%) since the inflation spike of 2008 and 10y swaps are essentially equal to the 2009 and 2010 highs around 2.85%. 5y inflation, 5y forward, which the Fed watches, is still "contained" at around 3.18% but neither 2.53%, 2.85%, nor 3.18% sounds like expectations the Fed is trying to target. Watch for the language to start to emphasize "relatively" contained.
The Employment release scheduled for tomorrow ought to be interesting. Clearly there is some emotional defensiveness about the report given that last month's 36k was clearly impacted by the weather - but one dealer last month said the effect was 40k while another said 150k-200k. The numbers were just a mess overall. The Unemployment Rate had plunged for the second month in a row to 9.0%, partly because of changes in the aggregate level of employment and the labor force in the Establishment Survey's benchmark revision. As I said last month,
"Essentially, the numbers are saying "we were a little high on the count of total jobs, but it turns out that was because we thought the whole country was bigger than it was, so even though there's fewer jobs there are also fewer jobless."
Ordinarily, when the stock market rallies and the bond market sells off headed into Employment on the basis of, or anyway supported by, Initial Claims (or if the circumstances are exactly reversed), I tend to want to fade the move. It is hard to believe that there are lots more investors to pour into stocks on a good number, because it doesn't look like many investors pared their risk today. But I don't trust that reasoning this month, because the numbers were so funky last month it isn't really obvious what would be a big surprise. I guess it will be easier to identify a very weak number than a very strong number, because we all expect some weather snap-back and something around, say, 100k on Payrolls would be disappointing. The Consensus is +196k.
The other reason that I don't see a lower-risk pre-number position is that it isn't entirely clear whether a very strong number would be good for equities or whether a bad number would be necessarily negative for the market. Chairman Bernanke has recently tied QE2 and the Fed's easy stance to the employment picture, saying that without a substantial improvement in employment it will be hard to say the recovery is on firm legs. Well, suppose we get a substantial improvement in employment. Does that imply a less-accommodating Fed? (Or, more to the point I guess, does it imply that investors will expect a less-accommodative Fed?) Would I be shocked to see the market trade lower on a strong report, the day after Trichet sounded hawkish (at least to the credulous)? Not a bit. And I wouldn't be surprised if the market rallied on somewhat weak data.
Now, with bonds it's a little easier. Strong data is doubly bad for bonds because it implies a less accommodative Fed and is seen to increase the chances of appreciable inflation. Weak data implies that the Fed continues to play Santa Claus and lessens the perceived chances of inflation: doubly good. With the selloff today, it is a harder call but I'd tend to prefer the short side. That meshes with my sense of the secular trend, but the market seems not to be in a trending mode at the moment.
The Unemployment Rate is expected to rise to 9.1% from 9.0%. Last month, the expectation was for a bounce to 9.5% from 9.4% and instead the Rate fell to 9.0%. But a lot of that fall was the result of the benchmark revision and should not be naturally expected to be reversed. But when the participation rate rises - someday - there will be some upward pressure on the rate (people returning to the labor force because they're looking for jobs will initially be jobless).
At least we are finally out of the worst of the seasonal adjustments and the weather issues. The tea leaves ought to become somewhat clearer. But that doesn't mean the market will stop being silly.


