• 989 days Will The ECB Continue To Hike Rates?
  • 989 days Forbes: Aramco Remains Largest Company In The Middle East
  • 991 days Caltech Scientists Succesfully Beam Back Solar Power From Space
  • 1,390 days Could Crypto Overtake Traditional Investment?
  • 1,395 days Americans Still Quitting Jobs At Record Pace
  • 1,397 days FinTech Startups Tapping VC Money for ‘Immigrant Banking’
  • 1,400 days Is The Dollar Too Strong?
  • 1,400 days Big Tech Disappoints Investors on Earnings Calls
  • 1,401 days Fear And Celebration On Twitter as Musk Takes The Reins
  • 1,403 days China Is Quietly Trying To Distance Itself From Russia
  • 1,403 days Tech and Internet Giants’ Earnings In Focus After Netflix’s Stinker
  • 1,407 days Crypto Investors Won Big In 2021
  • 1,407 days The ‘Metaverse’ Economy Could be Worth $13 Trillion By 2030
  • 1,408 days Food Prices Are Skyrocketing As Putin’s War Persists
  • 1,411 days Pentagon Resignations Illustrate Our ‘Commercial’ Defense Dilemma
  • 1,411 days US Banks Shrug off Nearly $15 Billion In Russian Write-Offs
  • 1,414 days Cannabis Stocks in Holding Pattern Despite Positive Momentum
  • 1,415 days Is Musk A Bastion Of Free Speech Or Will His Absolutist Stance Backfire?
  • 1,415 days Two ETFs That Could Hedge Against Extreme Market Volatility
  • 1,417 days Are NFTs About To Take Over Gaming?
Another Retail Giant Bites The Dust

Another Retail Giant Bites The Dust

Forever 21 filed for Chapter…

Market Sentiment At Its Lowest In 10 Months

Market Sentiment At Its Lowest In 10 Months

Stocks sold off last week…

Billionaires Are Pushing Art To New Limits

Billionaires Are Pushing Art To New Limits

Welcome to Art Basel: The…

  1. Home
  2. Markets
  3. Other

Watch What the VIX is Saying...

The VIX is regarded as the Fear Index by many, so you would expect it to be screaming "Fear" after yesterday's market drop, the Libyan and Saudi troubles, and the huge earthquake in Japan.

It isn't ... instead it is showing that the market is acting like it is relatively undaunted by all the above concerns.

So, let's look at two VIX charts today, and discuss what the VIX is saying ...

Our first chart shows the VIX from June 2010 to 12:57 PM today. Note that the spike on February 23rd. set the high for a new resistance line from July 2nd. 2010.

After that, the remaining action created a triangular pattern which was a set-up for a VIX breakout.

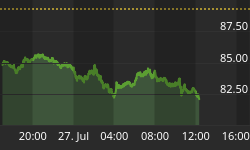
The VIX broke out to the upside on Thursday, but notice what the daily bar did. (See both charts, the second chart is a close up of the action.)

What did it do? Thursday's bar went right up to and touched the 8 1/2 month resistance line and stopped. And then today, the VIX pulled back into the triangular pattern. (See where it was at 12:57 PM in the second chart.)

So, for all the concerns that have plagued the market this week, the VIX is remarkably calm and suggesting that the market may have the gumption to climb a wall of worry. The odds will favor that possibility as long as the VIX remains below the June 2010 to March 11 resistance line.

VIX Volatility Index

Friday's 12:57 PM close up chart for the VIX.

VIX - Feb 22nd


(Not a subscriber yet? Give some thought to joining us as one of our paid subscribers and see the dozens of chart updates we post daily. Charts that include inflowing Liquidity levels, Institutional Investor Buying and Selling levels, Institutional Accumulation/Distribution and data not found anywhere else.)


Back to homepage

Leave a comment

Leave a comment