


Professional traders know the importance for NEVER doing the opposite of what Institutional Investors are doing.
That's because the market moves in the same direction that Institutional Investors are moving in.
When Institutional Investors are in Accumulation, the market goes UP.
When Institutional Investors are in Distribution, the market goes DOWN.
Want proof?
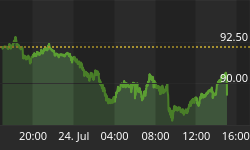
See today's Institutional Buying and Selling chart below. Here is how to read the chart:
* When the blue buying line is higher than the red selling line, then Institutional Investors are in Accumulation. When they are in Accumulation, the market goes UP ... plain and simple.
* When the red selling line is higher than the blue buying line, then Institutional Investors are in Distribution. When they are in Distribution, the market goes DOWN ... plain and simple.
Take a few minutes to look at today's chart and you will see how accurate it is for showing what the true market trends were. (This is just one of many charts that we post everyday for our paid subscribers ... It can be found on the Standard site: Section 4, Chart #6 ... Section 2 has our actual Buy/Sell trending models for the SPY, QQQQ, and IWM.)
* Current Note: Institutional Investors went in and out of low levels of Distribution on: Feb. 23rd. and 24th., and then on March 1st. and 7th. These were the warning signs of the more serious move to Distribution that occurred on March 10th. Institutional Investors are currently in Distribution.
Food for thought: Most investors would probably do a lot better by just trading in the same direction as this one chart that shows Institutional Accumulation and Distribution ... because Institutional Investors do Rule the market.
(This chart is presented as a courtesy to our free members today. In fairness to our paid subscribers, it will not be shown in this free page again until some time in April.)


